What can a StoryFit Content Insights tell you?
Each StoryFit Content Insights Report delivers specific insights to the most important elements of the story: Major Characters, Major Themes, Action. Dialogue, Emotion and Tone, Locations and Plot features. In this series we’ll give some examples of real movie scripts that StoryFit’s Artificial Intelligence ingested and what it reveals.
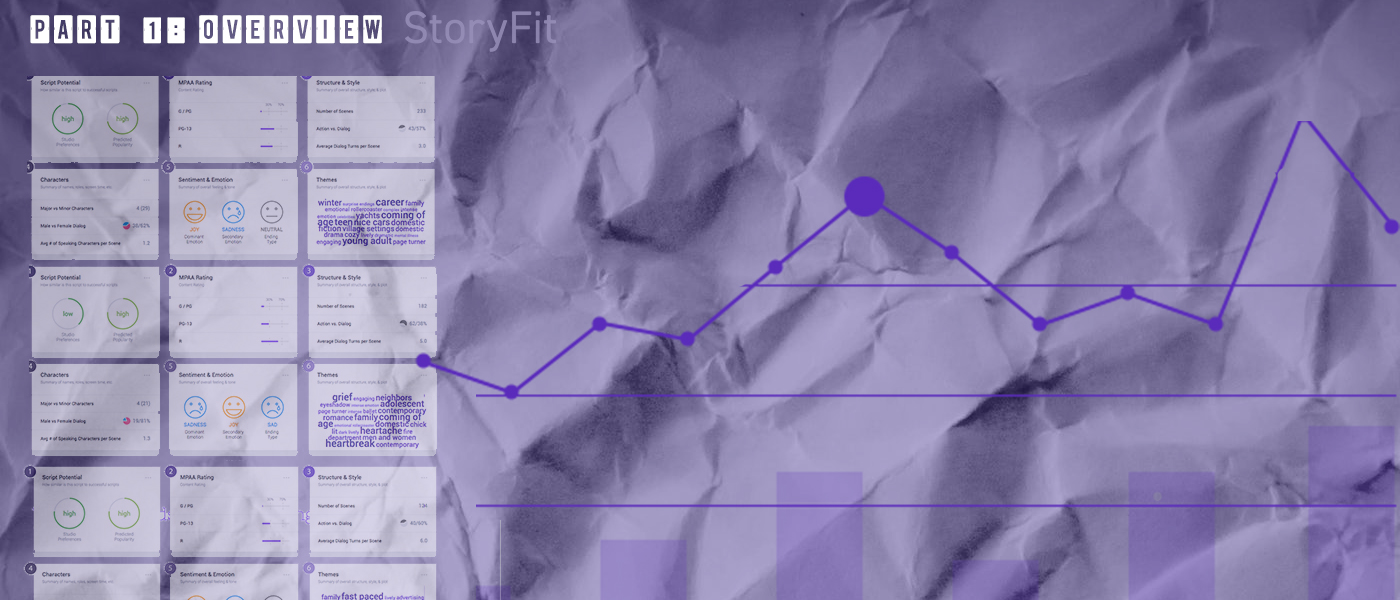
Before diving into any script, you probably want a general idea of what you’re getting into, right? A quick lil’ synopsis to give you some context going forward. Our answer to that is the script overview. We’ll go point by point through the overview section, with three StoryFit Content Insights Report excerpts from the recent movies I, Tonya, Mother!, and Three Billboards Outside Ebbing, Missouri. 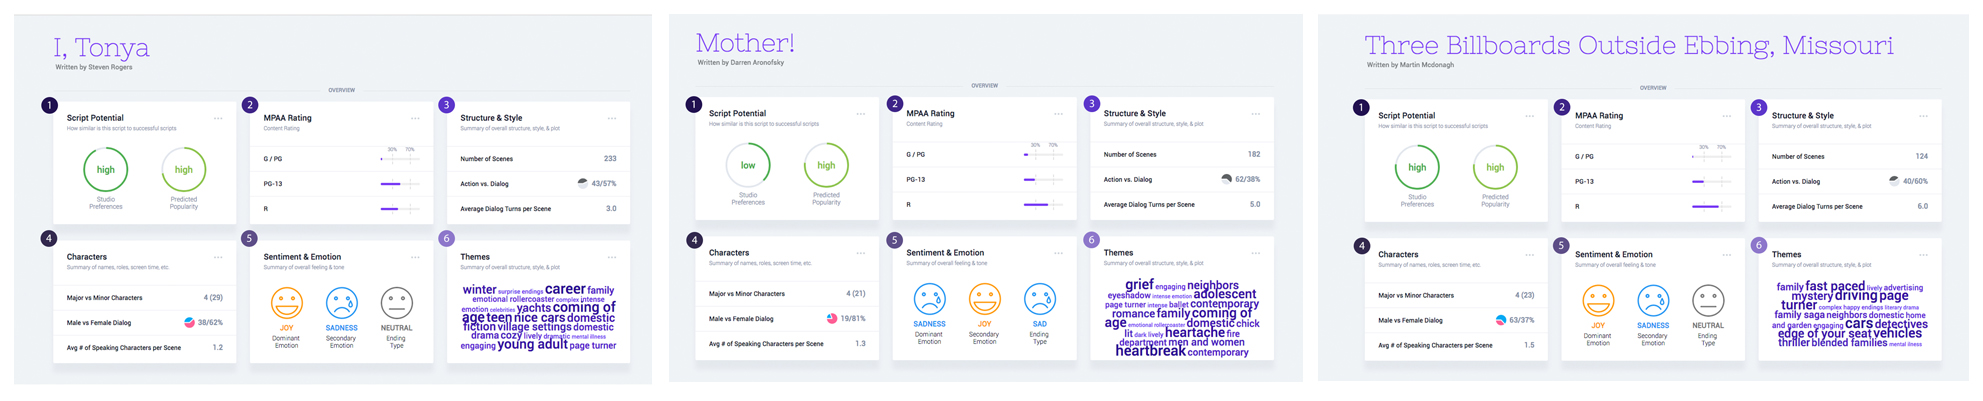
![]()
Script Potential
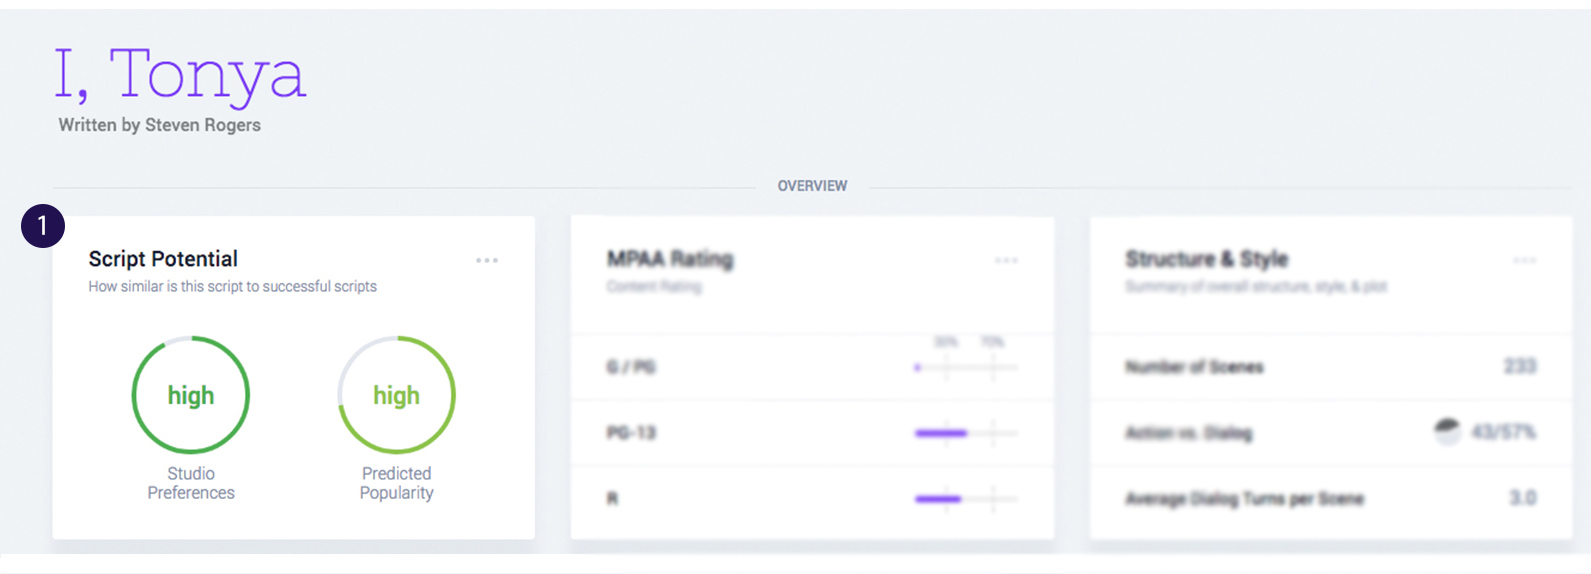
This part gives a rating from extremely low to extremely high of how much this script looks like a movie that will be well received by the general public (predicted popularity) or according to a specific studio’s parameters (studio preferences). The audience reception comes standard on all content insight reports–the studio score is a premium feature.
The “studio preference” is actually fully customizable and is based on a your preferences as a content creator or distributor. Think of it like an instant comparison to whatever collection of scripts you want to use. Most producers use their studio’s past productions in two buckets: successful and unsuccessful. Then they get a quick summary of how well the script they’re looking at fits within that group.
![]()
MPAA Rating
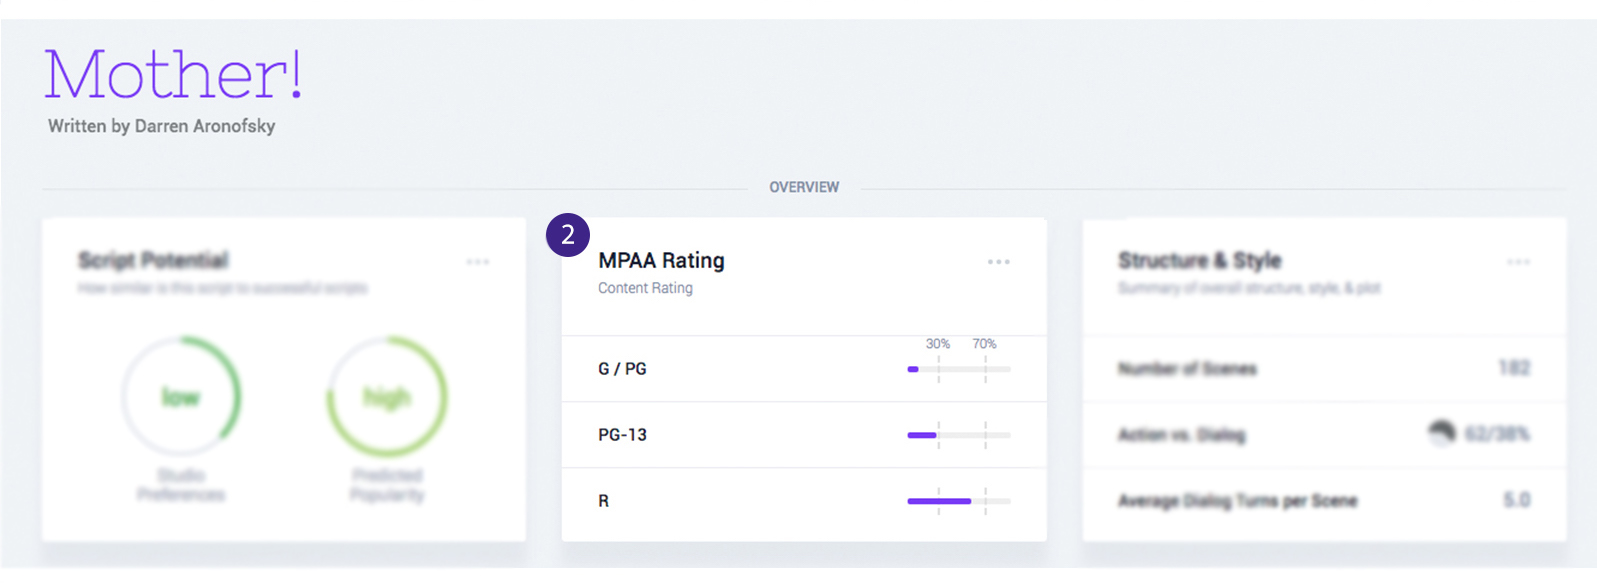
Is this a kids’ movie? How much do we need to take out the F bomb to get that R rating reduced? With this section, now you have an instant idea.
Adding up to 100%, what percentage of the script is considered G, PG-13, and R Material. StoryFit counts the number, instance, and severity of the sexual content, violence, and curse words/expletives found in the script and breaks it down, part by part.
![]()
Structure and Style
Summary of overall structure, style, & plot
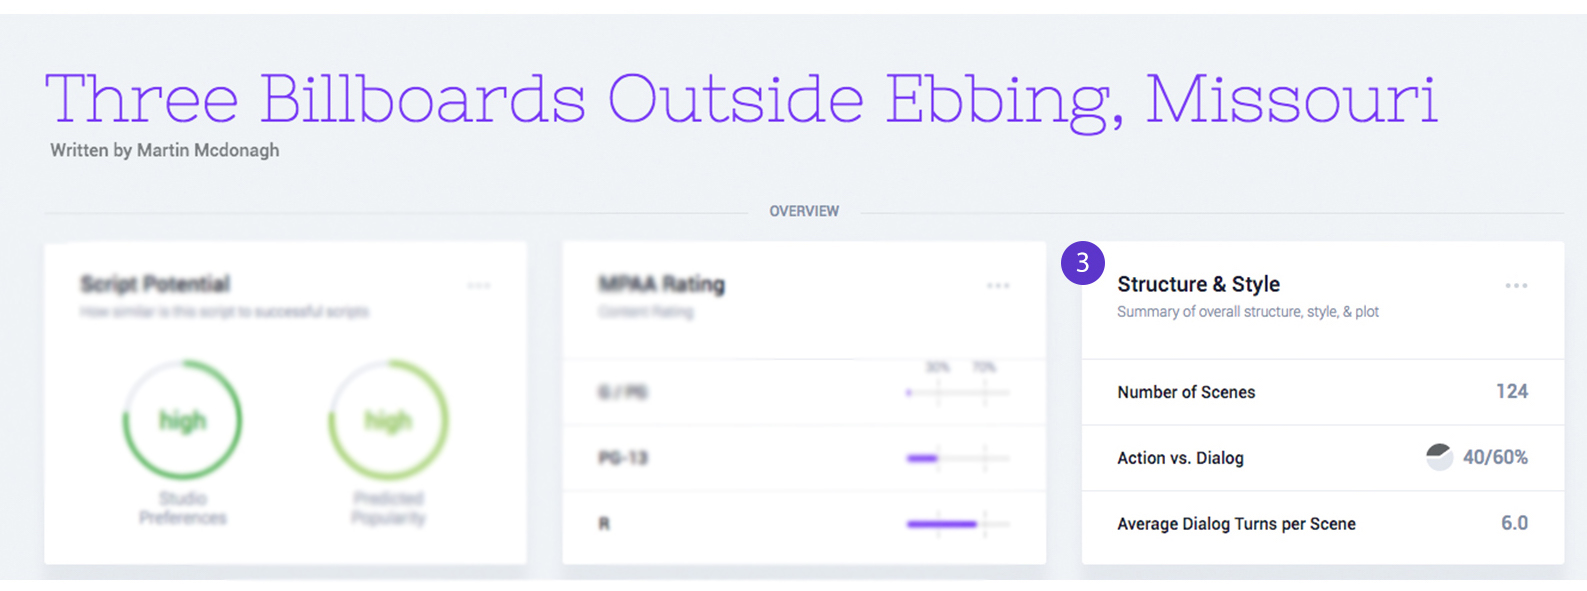
Is this going to be a tough movie to shoot? How active is it? Is it dialogue heavy? A lot of details go into answering those questions in detail, but at the top of every StoryFit Script Content Insights we give studios three major indicators to start considering their options: 1) the number of scenes; 2) the percentage of the script that is dialogue and the percentage that is action; and 3) the average number of dialogue turns per scene.
![]()
Characters
Summary of names, roles, screen time, etc.
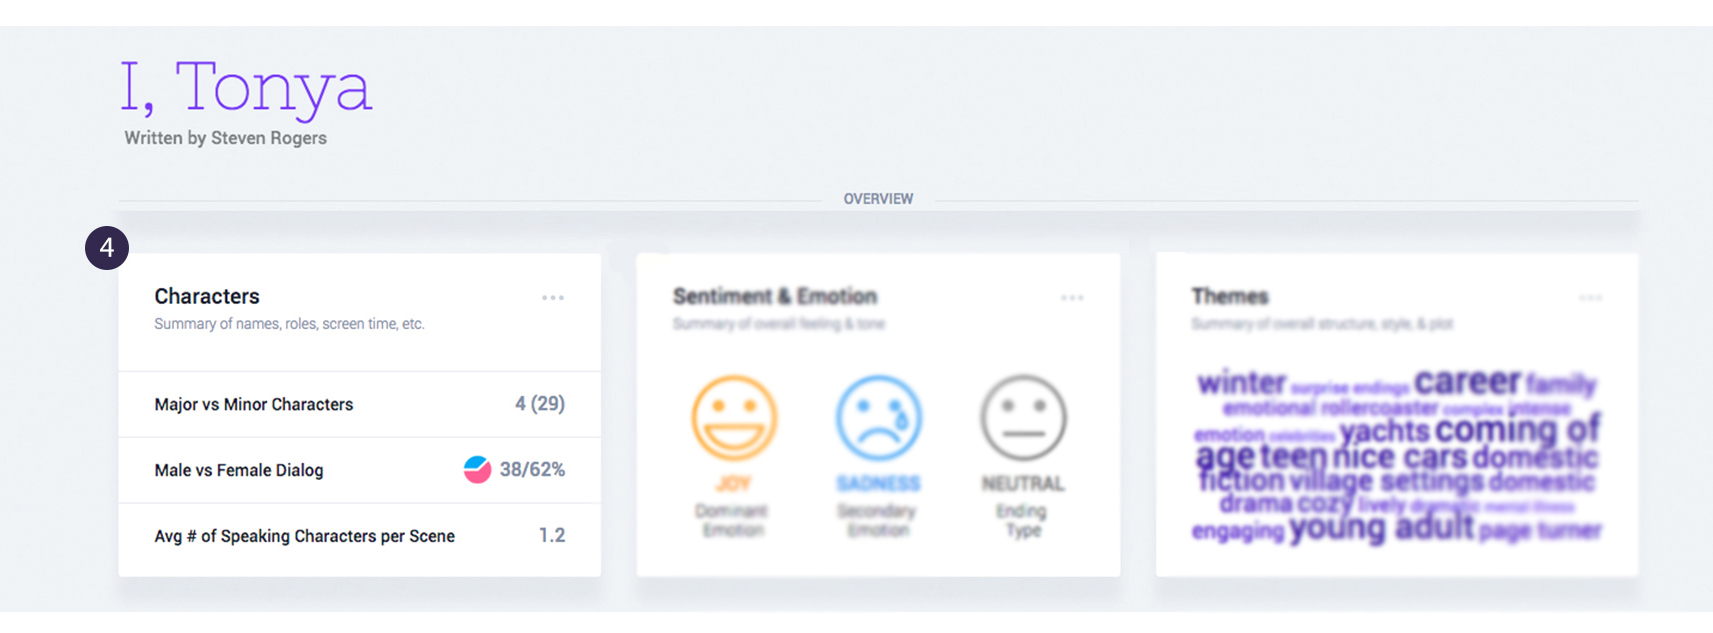
Instantly know: 1) how many major characters and minor characters are in the script, 2) if male or female characters speak more, and 3) the average number of speaking characters in each scene. With this script glimpse, studios can kick things off with questions like “Is this script an ensemble piece, or more intimate?”, “Are there any dead weight characters?” “How expensive is it going to be to fund leads?” “We’re really good at marketing to women — are the female characters talking enough in this script?”
![]()
Sentiment & Emotion
Summary of overall feeling & tone
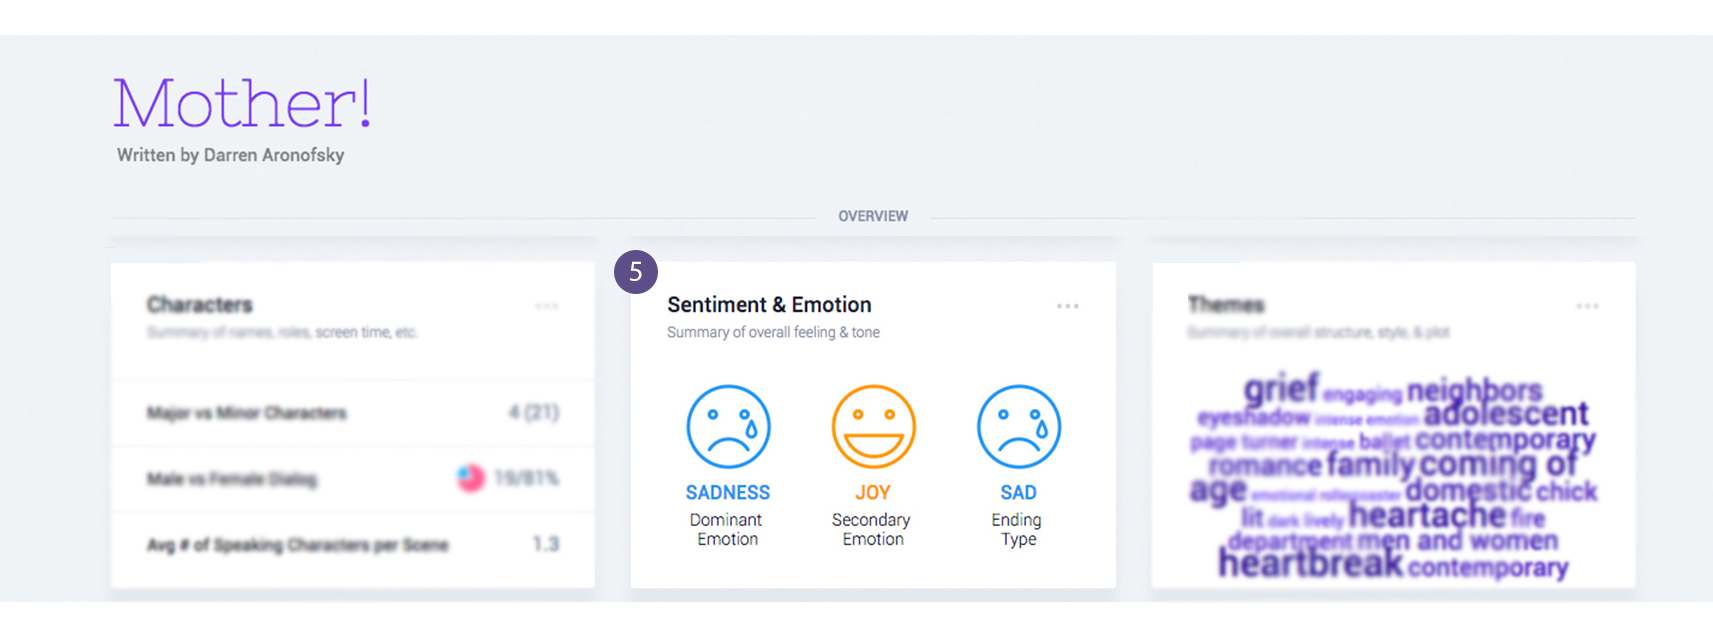
This is pretty straightforward. Is this a happy movie? A sad movie? A tearjerker with a happy ending? What kind of emotional journey is the audience in for? Later parts of the content insights go more in-depth on these notes–both the full emotional arc of the movie and the emotional change scene-by-scene.
![]()
Themes
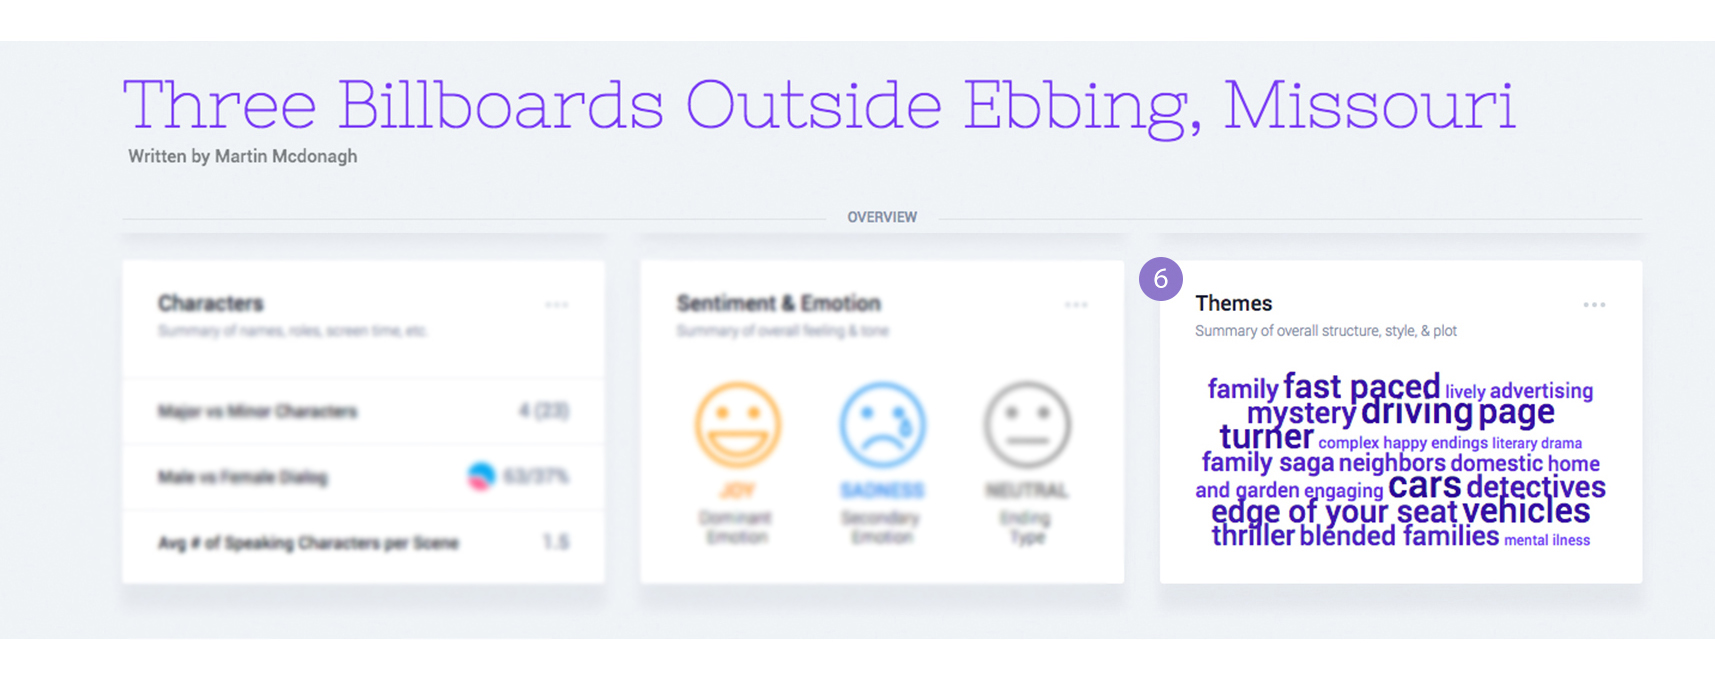
Shown here is a friendly word cloud, where we give studios a breakdown of the key elements of the story, how it’s told, and what the characters go through. Here is where you start to see the really granular, intuitive stuff that AI can find out.The bigger the word, the more that concept comes into play in the story.
So this will show you both important and frequent topics/ideas present. For instance, in Three Billboards Outside Ebbing, Missouri some of the words that stick out immediately are “family saga,” “cars,” “detectives,” and “thriller:” these themes come up often so they are bigger. But there’s also words like “mental illness” and “advertising,” which are slightly smaller, but no less important to the core story [no spoilers, promise!].
This part of the content insights report is also great for tracking development. As the script is edited, you can actually begin to see the focus shift as it is focused and refined.