White Paper: How Character Interactions Impact Drama Success
Posted: August 30, 2020 | Updated: April 24, 2023
Posted In: Articles, White Papers
In the following White Paper analysis, StoryFit will examine the noteworthy pattern of character interaction in a Drama film and its implied correlation with success for the genre.
Using StoryFit’s advanced story intelligence technology, representations of these relationships can be depicted through a unique interconnection of characters (StoryFit’s Character Network Graphic). These data points, along with other markers for success, prove to be consistent metrics for script success in Dramas.
Many thanks to researcher Rob Lewis, for his presentation of findings and overall support on this subject. To read his other notable publications, click here.
Table of contents
- Executive summary
- Background
- Why drama?
- Streaming means drama
- Episodic content lends itself to drama
- The psychology of drama
- Method
- Character social networks: a primer
- Sample
- Measurement
- Results
- Success of drama versus non-drama
- Network features of drama versus non-drama
- How character social networks predict ratings and popularity
- Sidebar: are there character network archetypes?
- Key questions and answers
- Learn by example: storytelling functions of multiple character-network components
- Conclusion
- References
1. Executive Summary
There is a special pattern of character interaction that is uniquely associated with drama success. Made visible by StoryFit’s platform, which represents characters in stories as interconnected social networks, this signal is reliable regardless of format (feature films versus series), runtime, or budget, and is consistent with understandings in media psychology.
Key findings
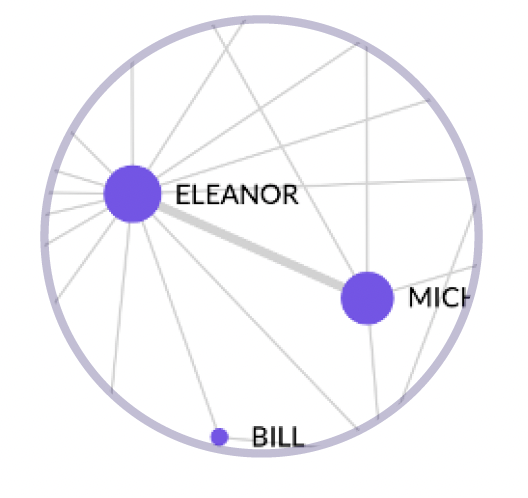
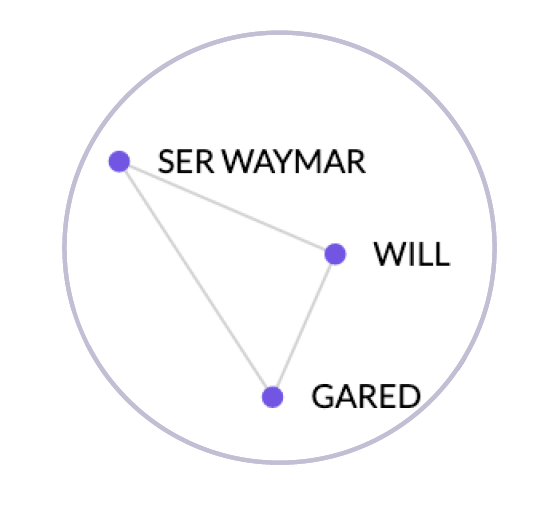
- 1. Complexity boosts drama success. The number of fragmented character groups, called network
components, in drama favorably impacts viewership and ratings. Network components represent characters who interact with each other but not with other internally connected character groups in the story (see figure below). Network components are a reliable predictor of viewership of both series and films (i.e., box office, opening weekend, and counts of audience ratings on IMDb). Network components are a reliable predictor of ratings for films (i.e., Rotten Tomatoes audience ratings, Rotten Tomatoes critic ratings, and IMDb star ratings). We illustrate through examples how these fragmented character groups add a form of complexity to the story that is favorable for drama viewership and ratings but not as impactful for other genres.
Examples of a multiple network components (highlighted) in film, pay TV, and SVOD pilot episodes:
- 2. There is room to optimize budgets by focusing on innovative storytelling. Important relationships between character networks with viewership and ratings remain even when we statistically control for film budget. Budgets greatly impact viewership and ratings as well as lead to more successful story features in movies; but this budget revelation is an important indication of the stand-alone importance of network components for drama, and likely other forms of complex, innovative storytelling.
- 3. The psychology of drama is different from other genres. Characteristics include more serious, conflicting, and complex storylines. When audiences are asked how much they “like” a story, they intuitively change the criteria for their judgments based on how dramatic the story is. Audiences judge other genres based on whether it is fun and entertaining, whereas audiences judge drama based on whether it is meaningful, moving, or thought-provoking. This difference explains why viewership and ratings for drama depend on different factors compared to other genres.
- 4. Dramas elicit favorable audience ratings. Drama receives more favorable audience ratings than other genres across both episodic and film. In films, though, viewership for drama is lower than for other genres even though audiences rate drama higher. For episodic content, by contrast, drama receives higher viewership and better ratings. We argue that the need for platforms to retain audiences across episodes makes drama well-suited to the context of series format.
- 5. The shift toward streaming platforms is increasing both the demand and supply for episodic drama. Streaming is now more popular than cable in the United States, and audiences’ appetite for episodic drama is at an all-time high. Of the top 20 streaming series, 15 of them are categorized as drama. In Q4 2019, drama had the most viewing consumption in the United States. The content on global and local streaming platforms contains proportionally more dramatic series than other types of content. Overall, drama accounts for an average of 45% of catalog duration across streaming platforms.
2. Background
Abstract
The goal of this report if to showcase how StoryFit‘s data on characters and their interactions impact six different metrics for viewership and audience ratings.
We use StoryFit’s technology to measure, at a scene-by-scene level, interactions across thousands of characters in feature films and pilot episodes. This report identifies what character network features are predictive of success for an increasingly important genre. Specifically, added complexity in character networks, in the form of fragmented character pairs and groups, is uniquely indicative of success for drama compared to other genres. Through several regression analyses, we highlight how a reliable predictor of both viewership and ratings is the depiction of characters’ interacting internally in a group to form multiple isolated groups — called network components. We even show that this relationship holds when we control for film budget, which has implications for budget optimization in drama production. Through several examples, we show how these fragmented network components represent story complexity and indicate creative ways storytellers move the plot forward emotionally and informationally. These results suggest content creators should focus more than they have in the past on complexity in drama through innovative storytelling.
Why drama
Drama is in high demand.1 To understand viewer’s appetite for drama, one must first look at the shift toward streaming platforms. Streaming penetration has been accelerating for more than a decade whereas pay-TV and cable have been in decline. These two trend lines crossed in 2018 when the number of Americans who subscribed to streaming platforms surpassed the number who subscribed to pay-TV
or cable.
The state-ordered quarantine in early 2020 has catalyzed streaming’s upward trajectory. Streaming platforms, including HBO Go, CBS All Access, Showtime, AMC, Sundance Now, and Adult Swim, announced special deals and even free content to entice more viewership as a result of the pandemic. Distributors began to bypass cinemas and go direct to streaming to connect with audiences. Crises have been known to cause more content consumption. An AdWeek article predicted 60% more television consumption in the United States based on previous major events that increased streaming, such as Hurricane Harvey of 2017 and Snowpocalypse of 2016, which temporarily caused geographically specific increases in streaming consumption.4 Nielsen already reported upticks in streaming in South Korea and Italy due to COVID-19. There was an overall 18% increase in television use of all sorts in early March, 2020 when the quarantine began.5 Streaming platforms are strategizing to retain this new audience attention beyond the pandemic’s timeframe.2,3
The virus is a catalyst for a shift that was already happening.
Just one day after the first known case of SARS-CoV-2, The New York Times published a feature titled The Streaming Era Has Finally Arrived. Everything is About to Change.6 The article documents factors such as the recent onboarding of once-reticent old-line media companies (Disney, NBCUniversal, and WarnerMedia) into streaming, the many different (300+) streaming platforms that serve specific niches (e.g., Horse Lifestyle), and the new dominance of Silicon Valley in the entertainment industry. In addition to these factors, audiences are also streaming due to frustration with the ads on cable, topping out at 20 minutes per hour in some cases. Audience preference is closer to eight minutes,3 with many frustrated with any ads at all.
Streaming means drama
The number of new, original scripted series on streaming platforms is increasing every year (more than 2x per year increase from 2010-2020 across all platforms).7,8 In terms of genre, demand is clearly highest for drama.1, 9-11 In 2019, for example, 15 of the top 20 in-demand streaming series in the U.S. were tagged as drama.1 In terms of audience demand share across the different popular streaming genres, drama grew by five percent in 2019 to approximately 50%, with comedy being a distant second-place in demand share at less than 20%. These same numbers hold for self-reported binge-watching as well.10
This dominance of drama is even greater in non-U.S. markets.1
Over time, Netflix has dropped thousands of film titles (films are less likely to be drama than series) while its episodic series catalog has soared.8 (As an example comparison from the most popular platform in global markets, Netflix has released about 200 feature films but more than 800 series — each series with far more content hours than a single film.) By contrast, the number of films increased only around 35% during the same period and actually dropped 10% in 2019.12 This content creation follows demand. More and more, audiences expect to be able to extend their niche experiences with the characters and stories they love, at their convenience, for as long as they wish.
The episodic content found in scripted series has begun to blur the lines between film and television in terms of production quality and even the managerial processes under which series are produced.6,13 Each format holds lessons for the other’s success. Yet, these scripted series retain a key feature of their episodic form making their relationship to drama advantageous compared to film.
Episodic content lends itself to drama
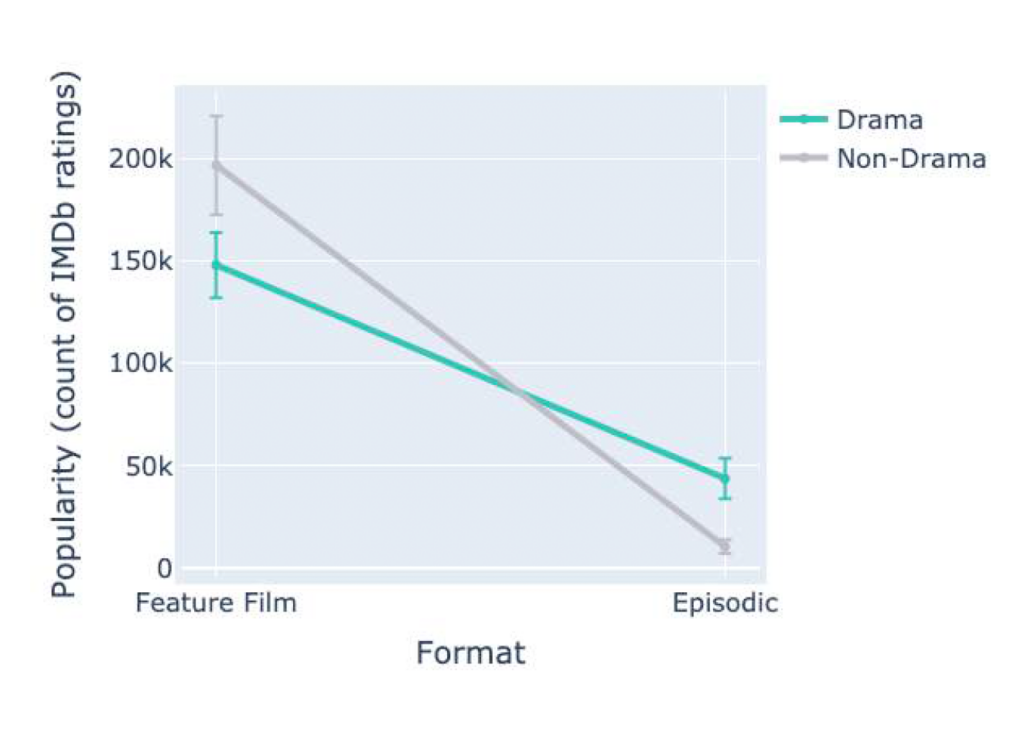
Shows like The Mandalorian, Game of Thrones, Orange is the New Black, and The Witcher provide high quality, fleshed-out character dramas one can watch from their couch–affordably–in extendable chunks. This increased convenience makes it harder to convince viewers to visit the theatre or watch commercials on cable. In addition to these factors, drama has higher viewership than other genres when it is in episodic form (see Fig. 1). A transition to streaming means a transition to more of this type of
episodic drama.
Figure 1. Drama viewership in feature films versus pilot episodes. Although viewership for drama is lower than for other genres in films (left side), we see the opposite in episodic content (right side). This pattern is consistent with our claim that episodic content lends itself to drama.
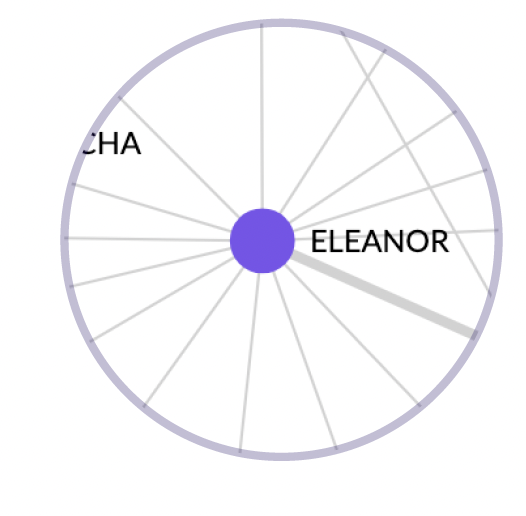
Success for scripted series depends on audience retention.14,15 As characters navigate through obstacles, narratives provide both conflict and resolution. To retain audiences for episodic content, a typical strategy is to introduce a tension point at the end of an episode or to leave a conflict unresolved. An example is found in The Mandalorian pilot, when the protagonist saves “Baby Yoda” in a way that clearly puts himself in danger. Multiple conflicts can simultaneously come to a head as well, such as when Eleanor from The Good Place pilot puts her friend in a difficult position while an authority simultaneously knocks on their door for an emergency; or Piper Chapman’s panic attack from episode 1 of Orange is the New Black, when she is served a tampon sandwich in the prison cafeteria and unexpectedly runs into her previous lover-turned-adversary. All of these events occur in the last few seconds of the episode and viewers must come back to even see whether they will get a resolution. As we discuss below, this type of unresolved mental dissonance is a defining feature of drama.
To navigate this new age of drama, content producers should look to past examples of drama in both film and television to understand what lessons can be leveraged for facilitating the success of future content. There are psychological reasons dramas are special in terms of audience appeal, and so the content features that lead to success are different from other genres.
The psychology of drama
By IMDb’s definition, drama must ”effect a serious narrative throughout the title.”16 Although other genres use tension and conflict as storytelling mechanisms, drama does it more–throughout the title–and leaves more of the conflict unresolved.
Drama is more likely to contain morally ambiguous characters,
tragic or dissatisfying resolutions, and moral dilemmas.
Compared to other genres, drama is appealing for different reasons. Most fictional genres focus more on “delighting” than on “enlightening”.20 Drama and even melodrama, at its best, allows audiences to contemplate the difference between right and wrong21 and potentially even grow morally.22 Dramas are a form of social-psychological playtime, providing a “moral sandbox”23 for audiences to consider potentially devious acts without any real harm. Dramas are for challenging intuitions with mitigating complexity. Audiences respond intuitively to characters with the deepest parts of their moral instincts much of the time. But when moral instincts come into conflict in complex situations, and are left unresolved by storylines (as in character dilemmas, tragic endings, or anti-heroes), audiences think about the experience more slowly, and report the experience to be more meaningful, moving, and thought-provoking.21 When content contains these types of dramatic depictions, audiences intuitively adjust the criteria for their own ratings of story content and begin to appreciate content that is, at least in some ways, emotionally dissatisfying.24 Consider a completely satisfying story ending in which every character receives precisely what s/he deserves. Immoral characters are punished harshly and virtuous characters are rewarded handsomely. Although there are no perfect examples, think old western movies depicting simple-but-fun good-guy bad-guy plots. Although audiences take pleasure in seeing this perfect justice, the experience is mostly intuitive and does not elicit slower mental effort.
Now, consider a different type of story in which liked characters are still experiencing loss or frustration at the story’s resolution point. An extreme example might be Schindler’s List, but equally valid examples are found in current drama series, such as Ozark, The Good Place, and even the docu-drama, Tiger King and the upcoming dramatic production featuring the same characters. The audience may not “like” the
endings of the films or episodes, or even the characters, but they will rate them high in terms of quality because they are meaningful or thought-provoking. Often, successful dramas mix elements of hedonically pleasing justice and likable characters with dissatisfying resolutions and morally ambiguous characters (e.g., Shawshank Redemption).
It makes sense, given audiences think about drama differently, that the criteria for success in terms of viewership and ratings might also be different for drama. Compared to all other fictional genres, characters in film dramas have a linguistic style more focused on social relationships (more use of function words, pronouns, as well as “social” words like “they,” “she,” “us,” “talk,” and “friends”), are more likely to discuss mitigating circumstances (more use of prepositions like “but” or “except”), as well as
more use of words related to justice (“fairness”, “equity,” “rights”). And greater use of such function words and prepositions is related to higher audience ratings but lower viewership, a pattern that maps onto enjoyment versus appreciation.17 Drama’s focus on more complex relationships and moral conflict, along with the altogether different psychological experience of drama, likely impacts how character interaction patterns influence ratings and viewership. Social-network analysis provides a lens through
which to observe these character-interaction patterns quantitatively.
3. Method
Character social networks: a primer
How can character-network graphs, a form of data that represents characters and their interactions, also reveal concrete features of good drama that lead to better ratings and higher gross earnings? Four metrics from social-network analysis are important in this investigation.
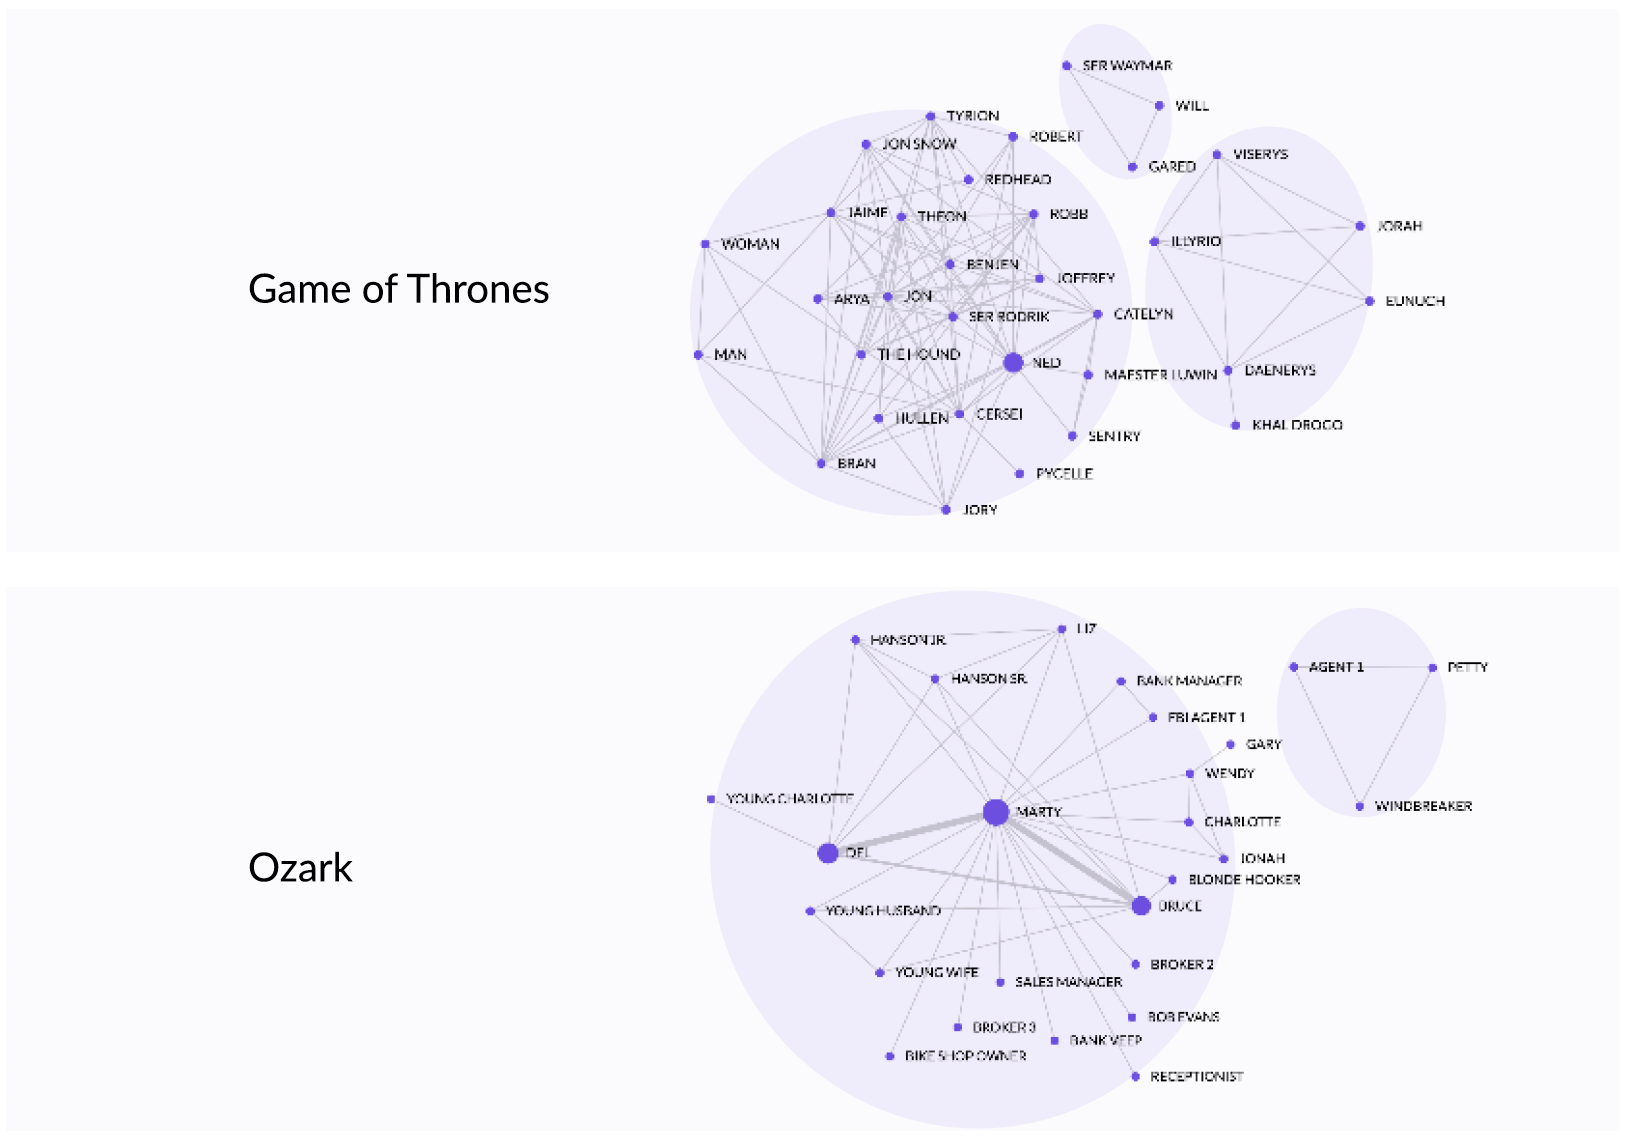
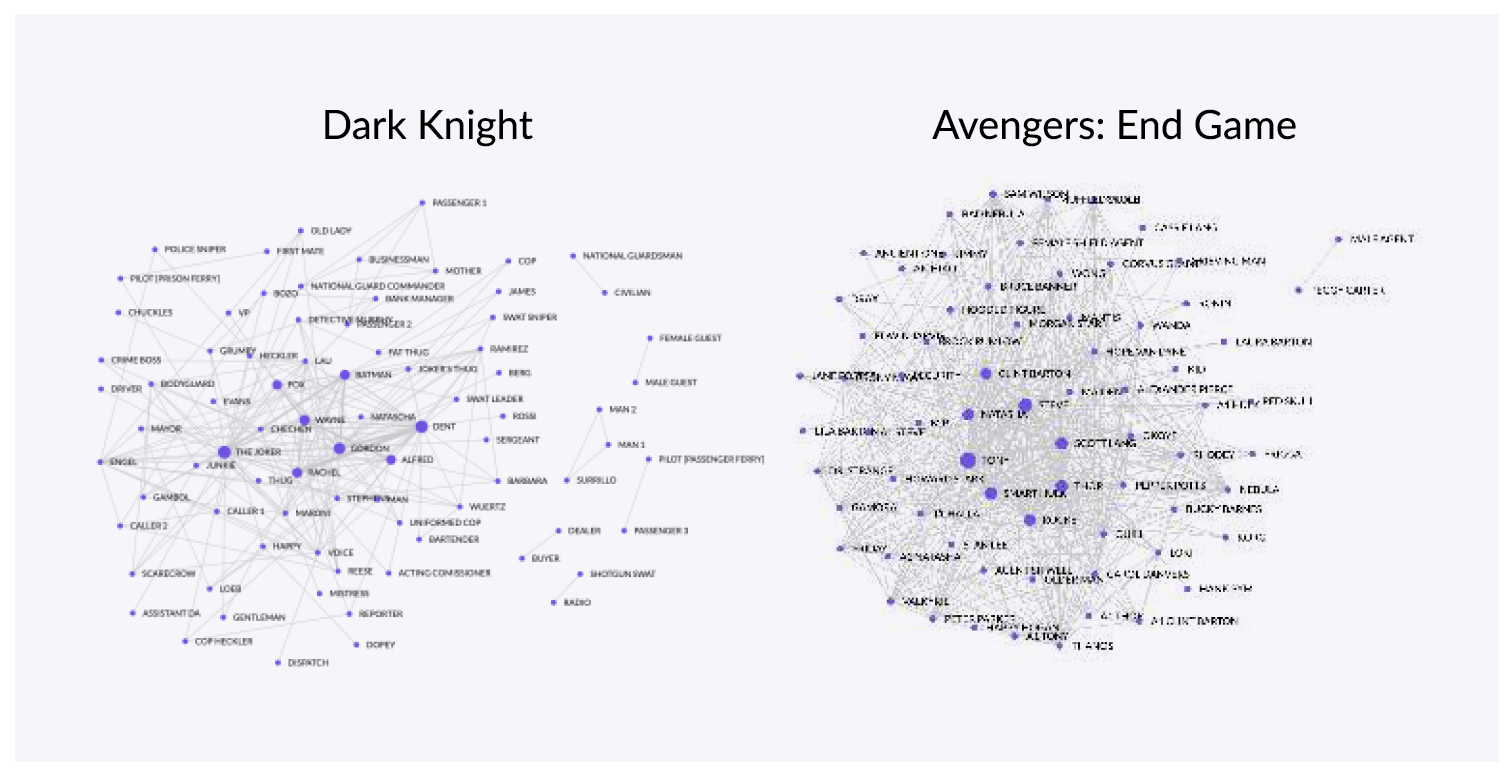
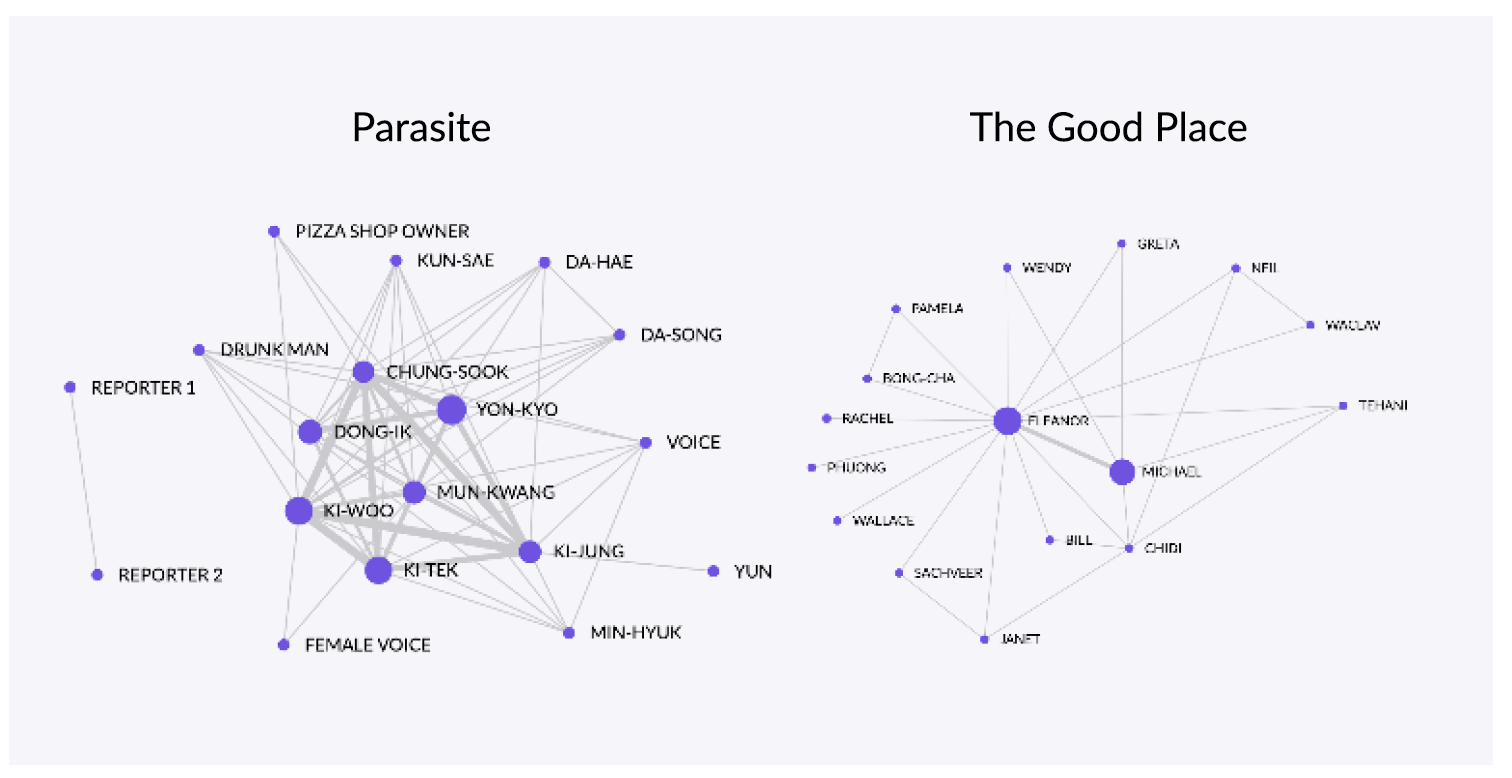
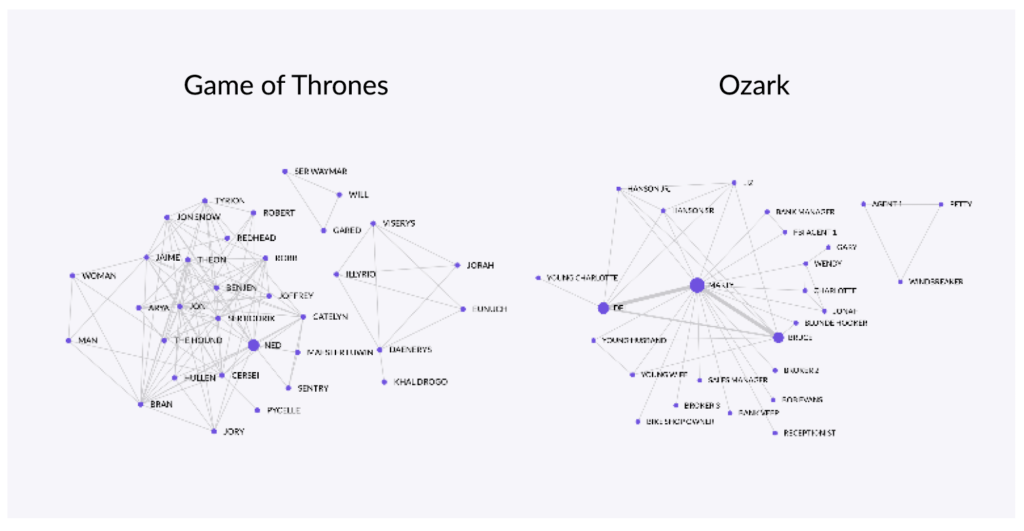
Nodes: Refers to the individual characters in the story. As Figure 2 reveals, some stories have a lot more characters than others. The Dark Knight (a feature film) has 81 nodes whereas The Good Place (a pilot episode) has 16 nodes. In rare cases, characters in stories that do not interact with any other characters are not included as nodes in our investigation.
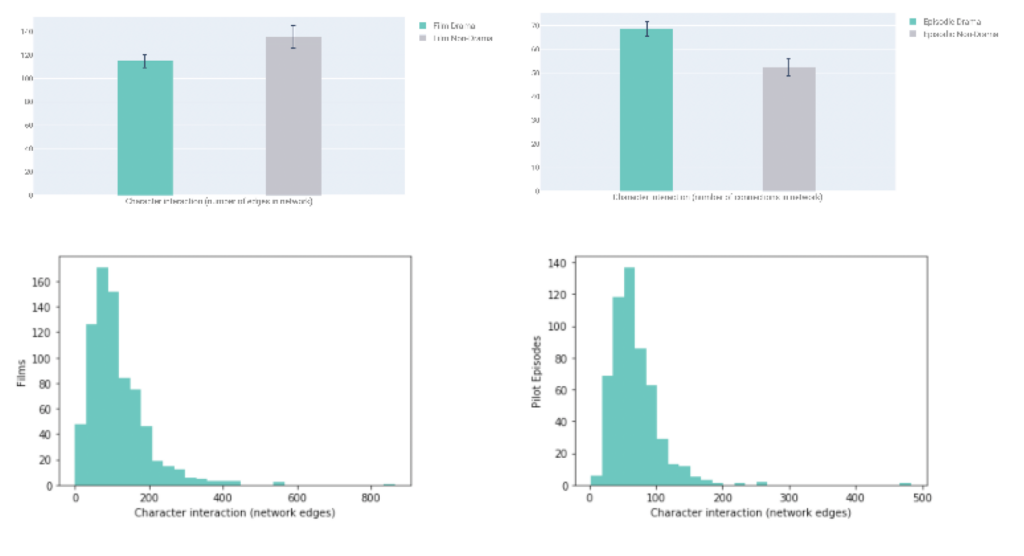
Edges: Refers to the interactions between characters. The edges between the character nodes mean both of those characters had dialogue in the same scene. In Figure 2, the thickness of the connection increases with the number of shared scenes. Avengers: Endgame (a film) had 434 edges, the most in Figure 2. By contrast, Ozark (a pilot episode) had the least number of edges at 43.
Components: Refers to the character groups depicted as disconnected sub-networks visible in five of six examples in Figure 2. These groups of disjointed characters are called components. When a story has multiple components, it is not always accurate to say components are “auxiliary,” as sometimes each component has equal prominence in the storyline. The set of examples in Figure 2 is atypical, since the majority of character networks in our data have only a single component (65% of feature films and 75% of series pilots have a single component).
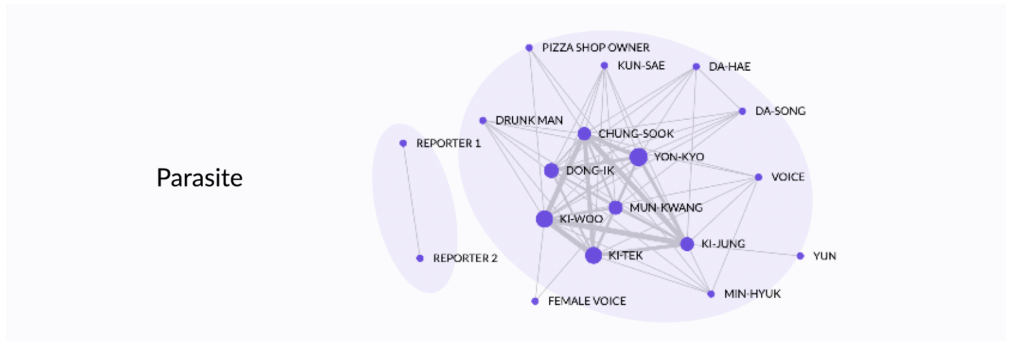
Density: Refers to the number of interactions that actually happened divided by the number of possible interactions between all of the character nodes in the network. The intuitive definition of density is how “connected” the network is as a whole. Some characters never appear in a scene together, and this makes the density decrease, all things being equal. If every character shares dialog in at least one scene with each of the other characters, density equals 100%. In Figure 2, The Dark Knight has the lowest density at 6% whereas Parasite has the highest density at 39%.
Figure 2. Network representations of the characters in feature films (top row) and episodic pilots (bottom row). Connections between character nodes represent dialogue in the same scene. Thickness increases with the number of shared scenes.
Sample
Metrics from network analysis (nodes, edges, components, and density) were extracted from scripts for each of the films and pilot episodes and computed with StoryFit technology. Our sample of scripts includes both feature films and pilot episodes, 95% of which were released post 2000, and 80% post 2010. For the sake of comparison, we use a large sample of drama as well as non-drama from both pilot
episodes and films.
Measuring success
Rating versus Viewership
The content people value is not always the same as the content they consume.26
For film, we use opening weekend box office, overall domestic box office, and the count of IMDb ratings for the title (not the star ratings themselves) to indicate popularity in terms of viewership. We use IMDb star ratings as well as Rotten Tomatoes critics and audience ratings to indicate audience ratings. For pilot episodes, we use IMDb ratings to represent ratings as well as counts of the ratings to represent viewership. We conducted a factor analysis showing these six separate metrics capture two underlying types of success: ratings versus viewership (see Table 1).
Table 1. Six separate metrics capture only two underlying forms of success. The bold numbers represent the strength of the metric’s relationship to the more abstract column labels (ratings versus viewership). Principal components analysis (a data-reduction tool) showed this two-factor solution explains 85% of variation in the six success metrics.
| Ratings | Viewership | |
| IMBd Star Rating | .95 | .16 |
| Rotten Tomatoes Audience Score | .93 | .15 |
| Rotten Tomatoes Critical Score | .88 | -.02 |
| Opening Weekend Earnings | -.07 | .95 |
| Domestic Gross | .13 | .95 |
| Count of IMBd ratings | .50 | .65 |
Statistical controls
Budget: Longer stories naturally contain more characters and interactions than shorter stories. To look at how character social-networks relate to success separately from the effect of story length, we control for runtime in minutes in some analyses.
Budget: Budget data were available for films. Higher-budget films are more successful, and are likely to contain more appealing character-network features. We control for budget in some analyses to look at the effect of network features on success separately from the effect of budget.
4. Results
Comparing success of drama versus non-drama
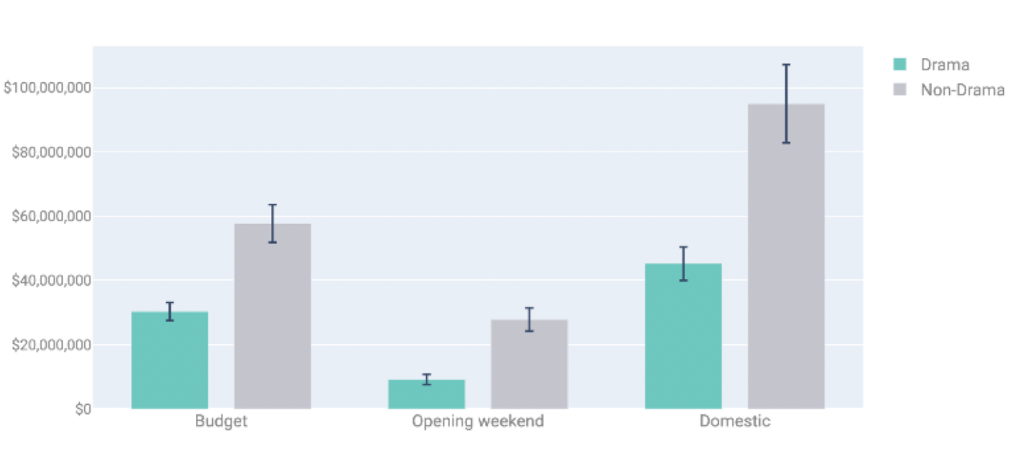
Feature films: For feature films, drama has a lower budget, lower opening weekend, and lower domestic box office gross than non-drama. See Figure 3.
Figure 3. Financial data for feature films. Error bars represent 95% confidence intervals around mean.
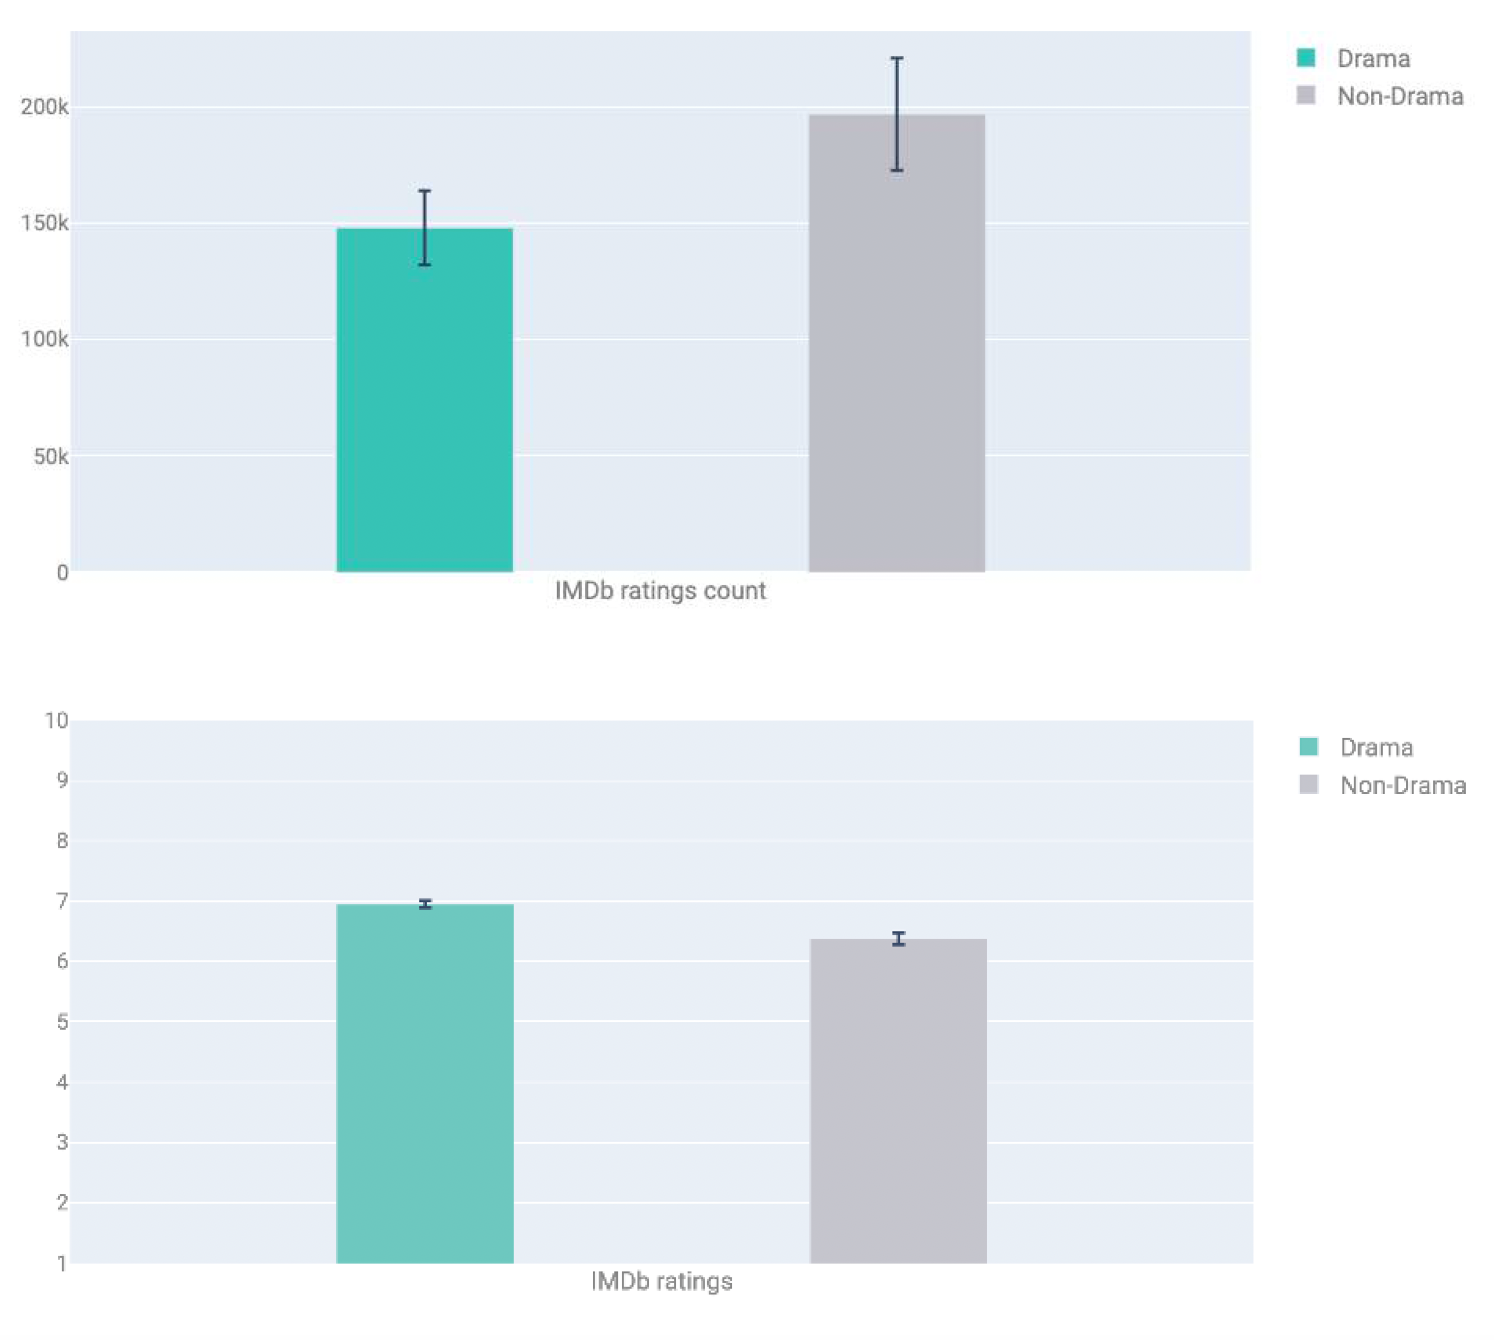
Our viewership metric from IMDb displayed in Figure 4a shows drama to be lower than other genres. By contrast, IMDb star ratings displayed in Figure 4b for films are higher for drama than other genres.
Figure 4. Comparing drama versus non-drama films on viewership (a) on top and ratings (b) on bottom.
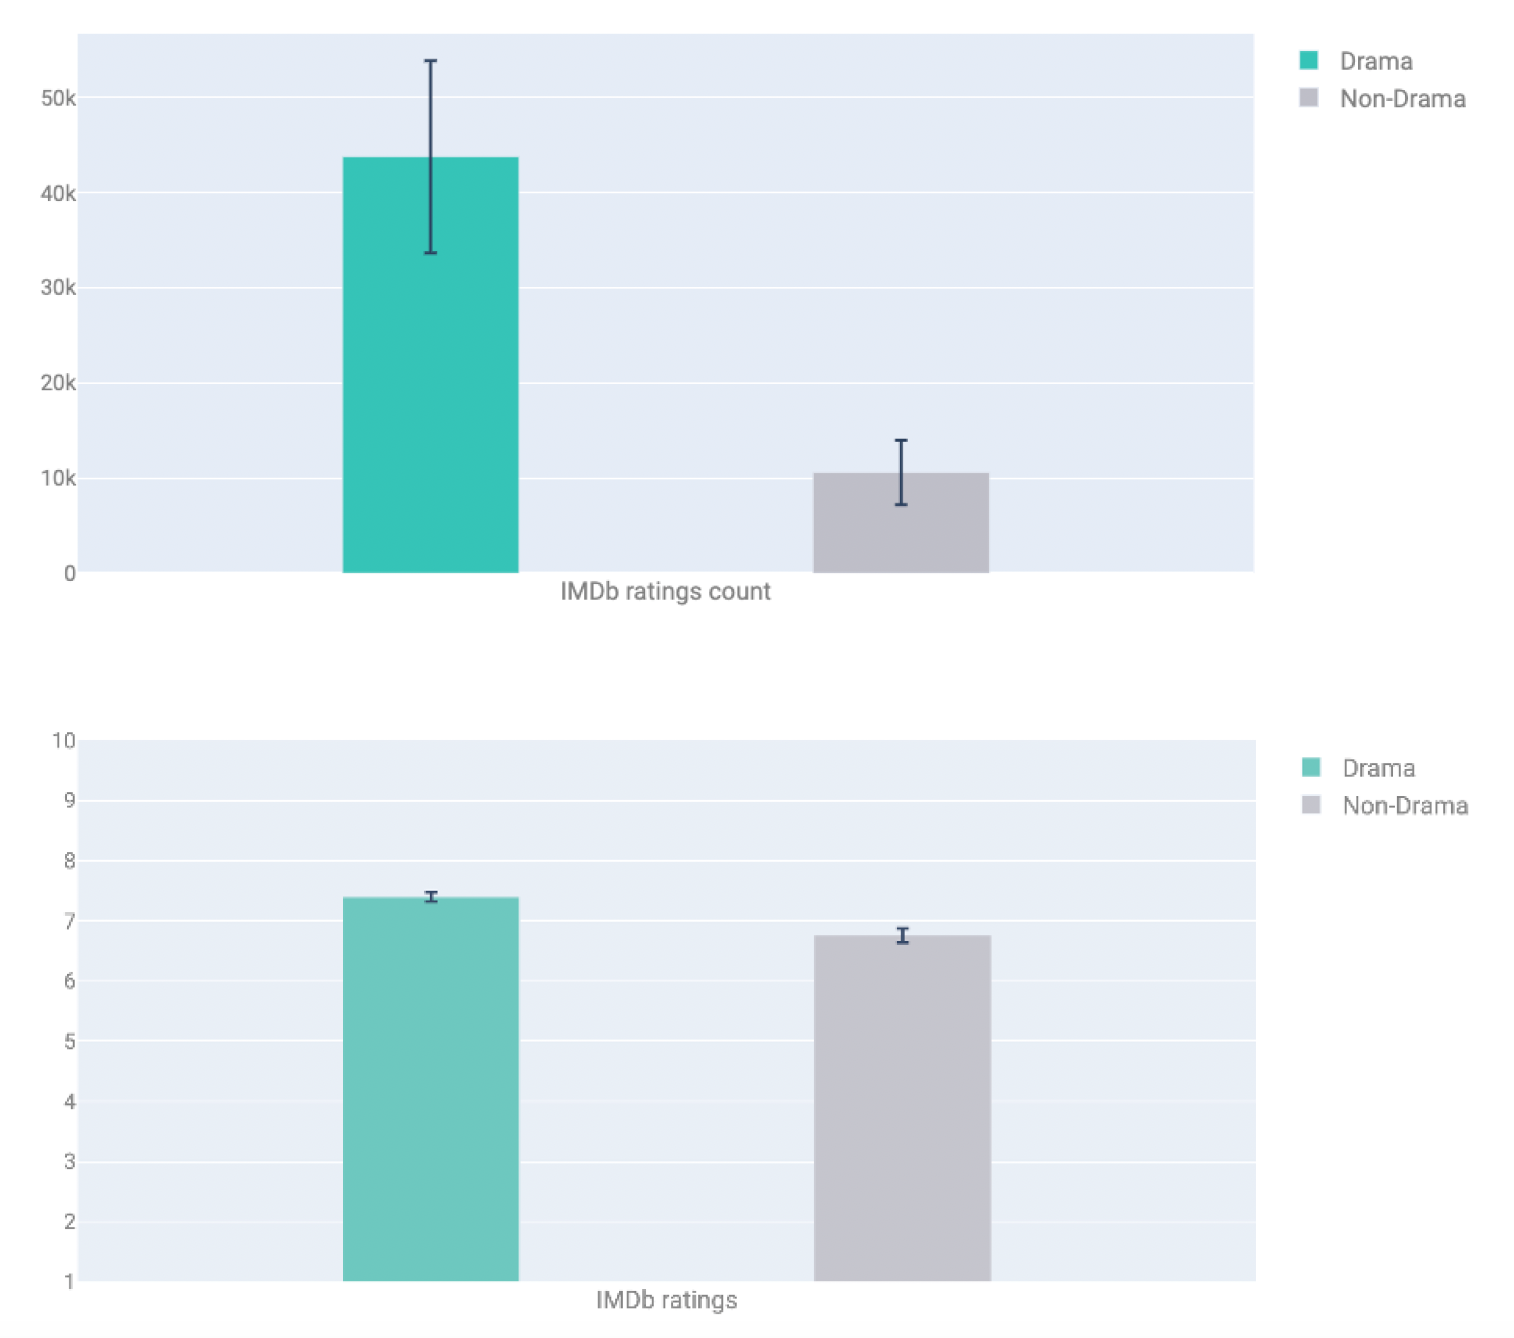
Pilot episodes: Episodic content shows a slightly different pattern than feature films. Drama performs better both in terms of viewership counts and star ratings on IMDb compared to non-drama.
Figure 5. Comparing drama versus non-drama pilot episodes on viewership (a) on top and ratings (b) on bottom.
Network features of drama versus non-drama
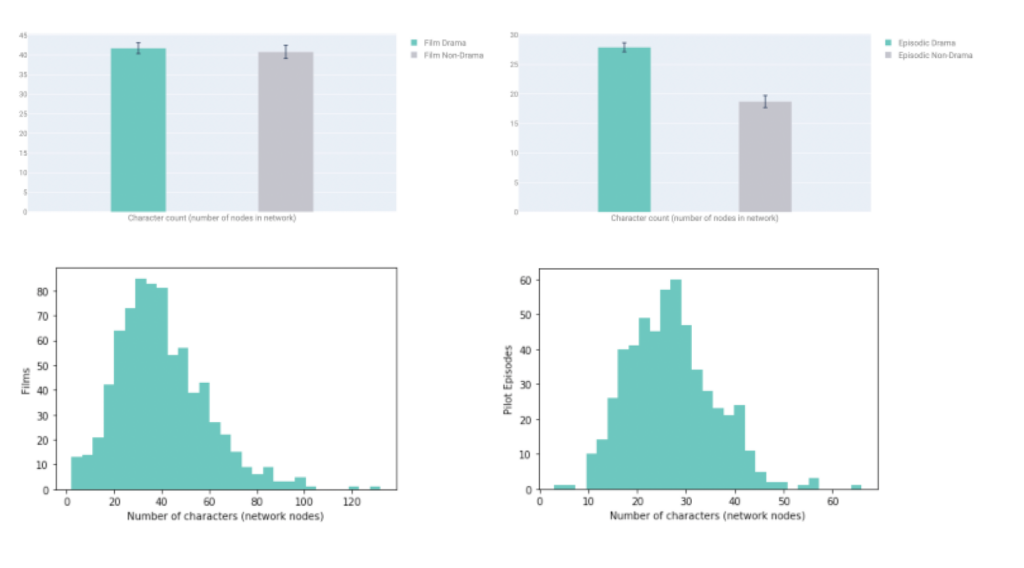
Number of character nodes: Drama in our film sample depicted slightly more character nodes than non-drama. This pattern is greatly exaggerated for episodic content. Note the shapes of the distributions for pilot episodes and films are similar (true for all network features).
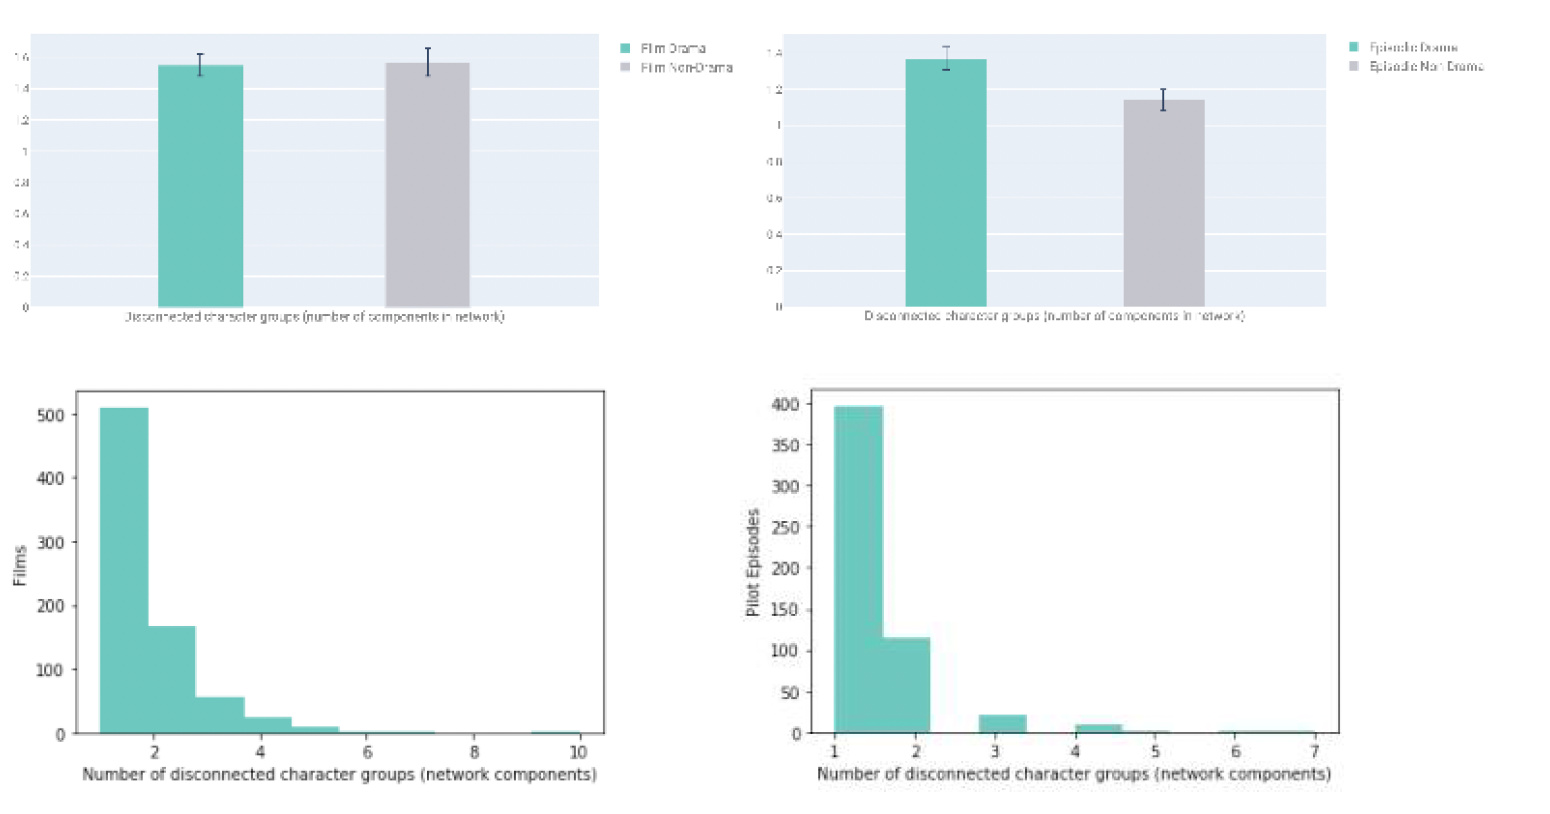
Number of components: The most common number of components is one (65% of films and 75% of series). No difference was detected between drama versus non-drama for films. But in pilot episodes, drama has a greater chance of having two or more network components.
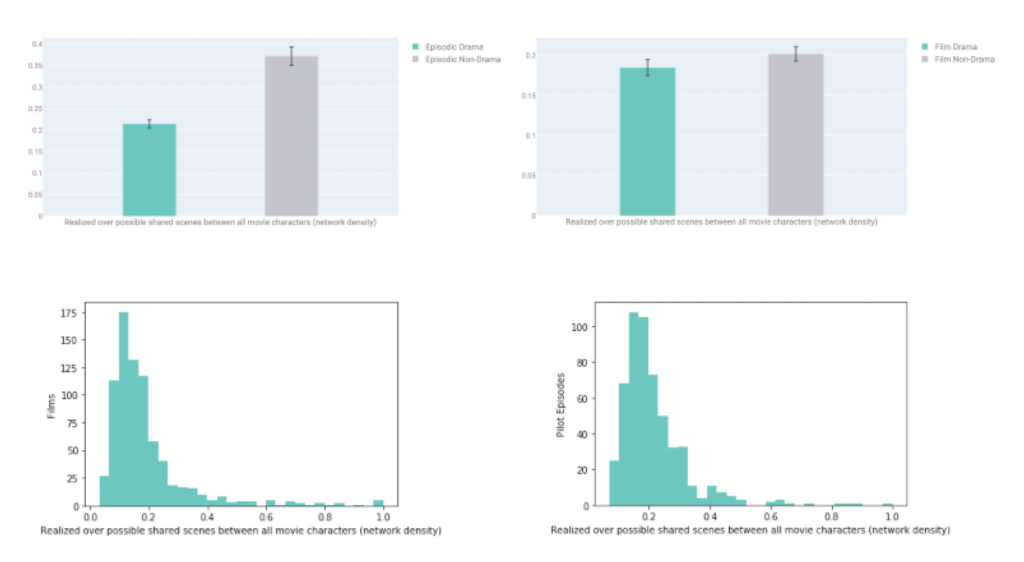
Density: Network density was lower for drama than for non-drama, a pattern in both films and pilot episodes. This means characters in drama are “less connected.” Any given characters in a story tagged as drama are less likely to have interacted in a scene together than characters in stories not tagged as drama.
How character social networks predict ratings & popularity
The key take-away from the regression analyses in Table 2 is that in both pilot episodes and feature films, the number of components positively predicts viewership for drama but not for non-drama. The number of network components also predicts ratings for drama films but not for non-drama films. As such, this pattern seems unique to drama. Although every story’s character network (regardless of
genre) is of crucial importance to its success, there is a common pattern for dramas. After controlling for runtime, the number of network components is the only significant predictor across all success outcomes for drama.
For pilot episodes, IMDb gives ratings of both the episode as well as the entire series.
Network components measured in pilot episodes predict both the episode viewership as well as series viewership for drama but not for non-drama.
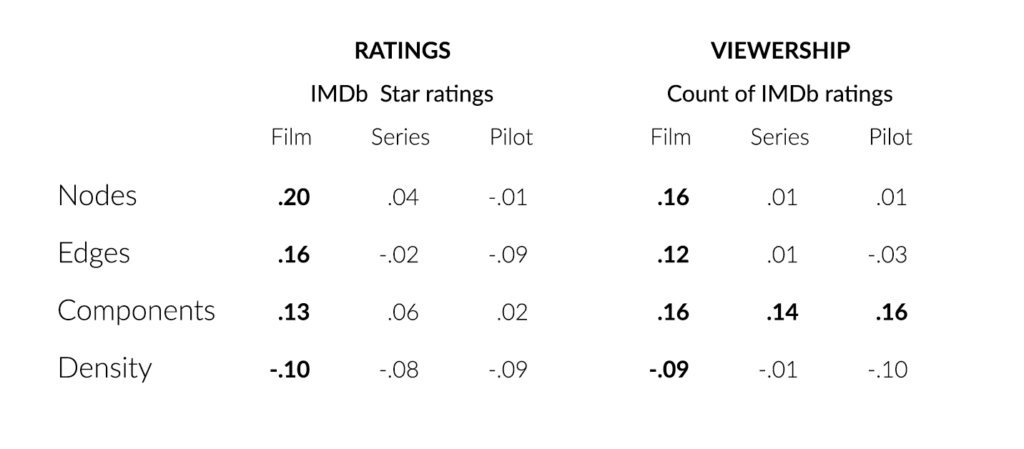
Table 3 presents the same associations but without controlling for runtime or other network features.
Table 2. Standardized regression coefficients (β) for character-network features predicting ratings versus viewership. Output for drama is on top half and non-drama on bottom half. Note the reliably significant coefficients for network components (in bold) for drama. Network components in pilot episodes predict both pilot viewership as well as overall series viewership. Network components in film predict viewership and audience ratings as well.
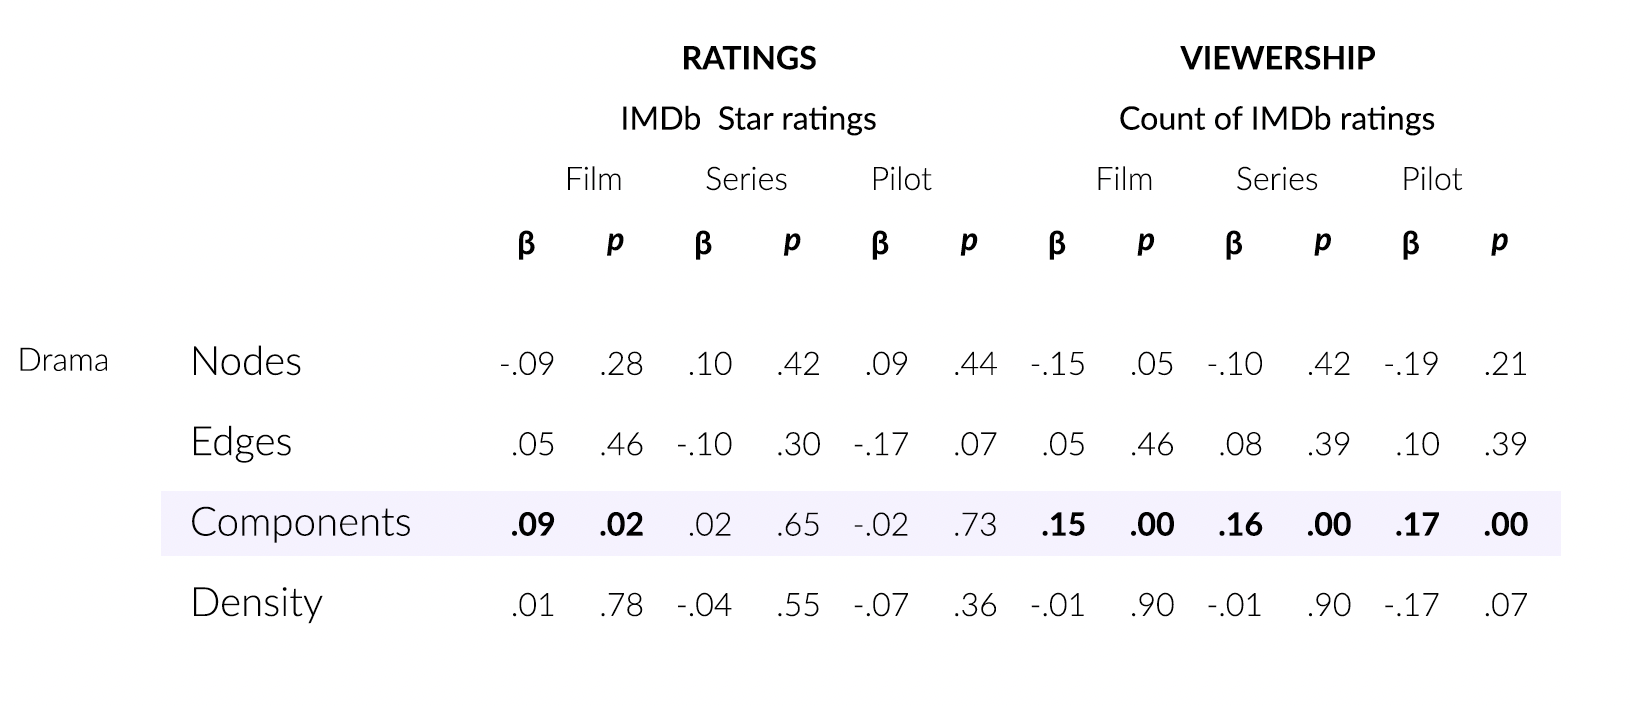
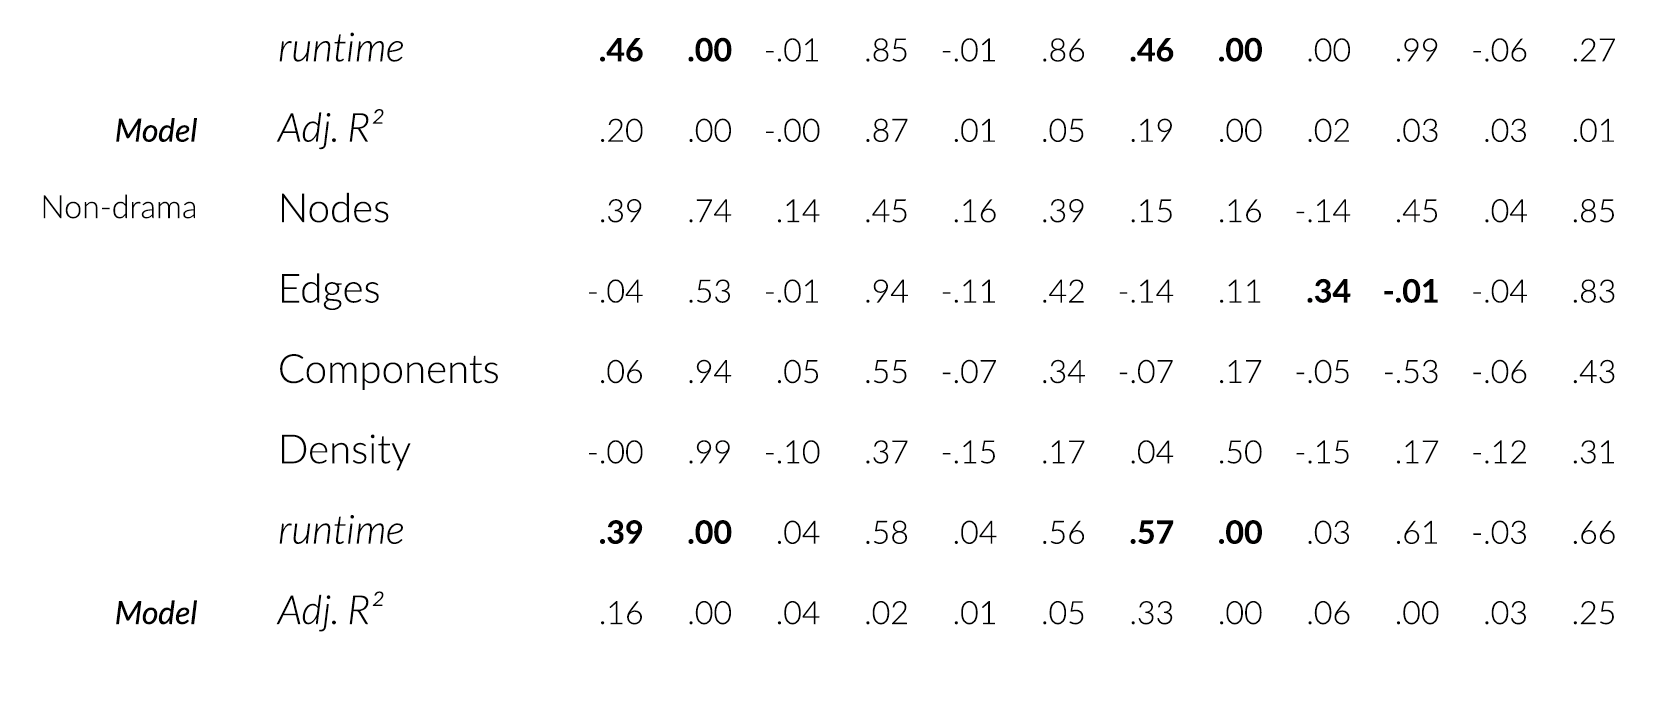
Table 3. Zero-order Pearson correlations for dramas (not controlling for runtime or budget) with IMDb success outcomes. Note: Coefficients in bold, p < .01.
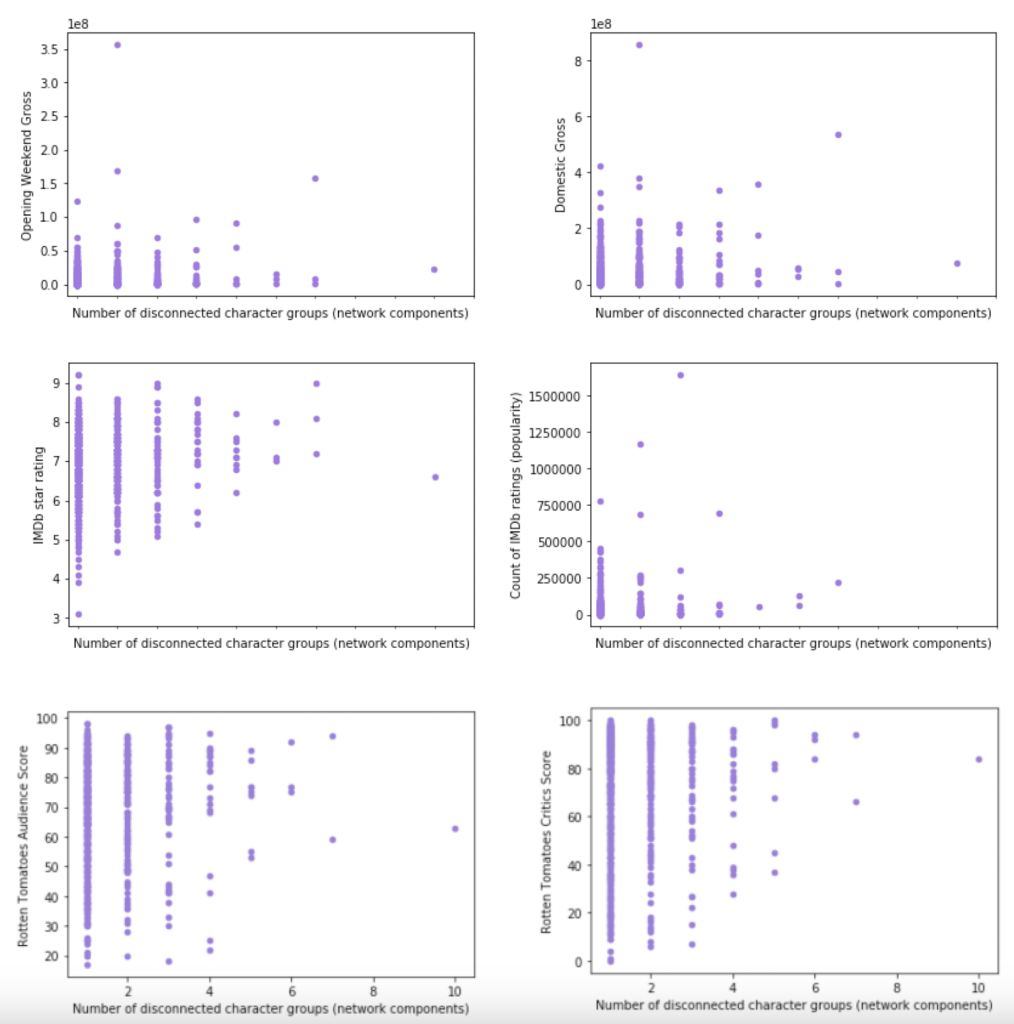
For films, we also controlled for budget to see whether network features explain any proportion of success or failure distinct from the association with budget. That is, is there room for producers to spend more budget on innovative writing to achieve more favorable ratings or viewership? Whereas budget has less of an impact on success for drama than non-drama, five of six success metrics show a significant impact of network features on success for drama (see Table 4). As in the analyses above with IMDb ratings and viewership, the only network feature significantly predicting success for drama (when controlling for budget) was the number of network components, with beta coefficients ranging from a low of β = .07, p = .16 for Rotten Tomatoes Audience Ratings to a high of β = .10, p = .03 for domestic gross. See Figure 6 for visualizations of the relationships between the number of network components and ratings versus viewership.
Table 4. Hierarchical regression models with budget alone (model 1), then with added network features (model 2) predicting the six success outcomes for ratings and viewership. Note the pattern of bold (statistically significant) numbers representing variation explained in ratings and viewership. Budget does not explain away the effect of network features for dramas, and so there is possible room for greater investment in writing appealing character networks for dramas. Note: ΔR2 coefficients in bold represent significance at p < .001.
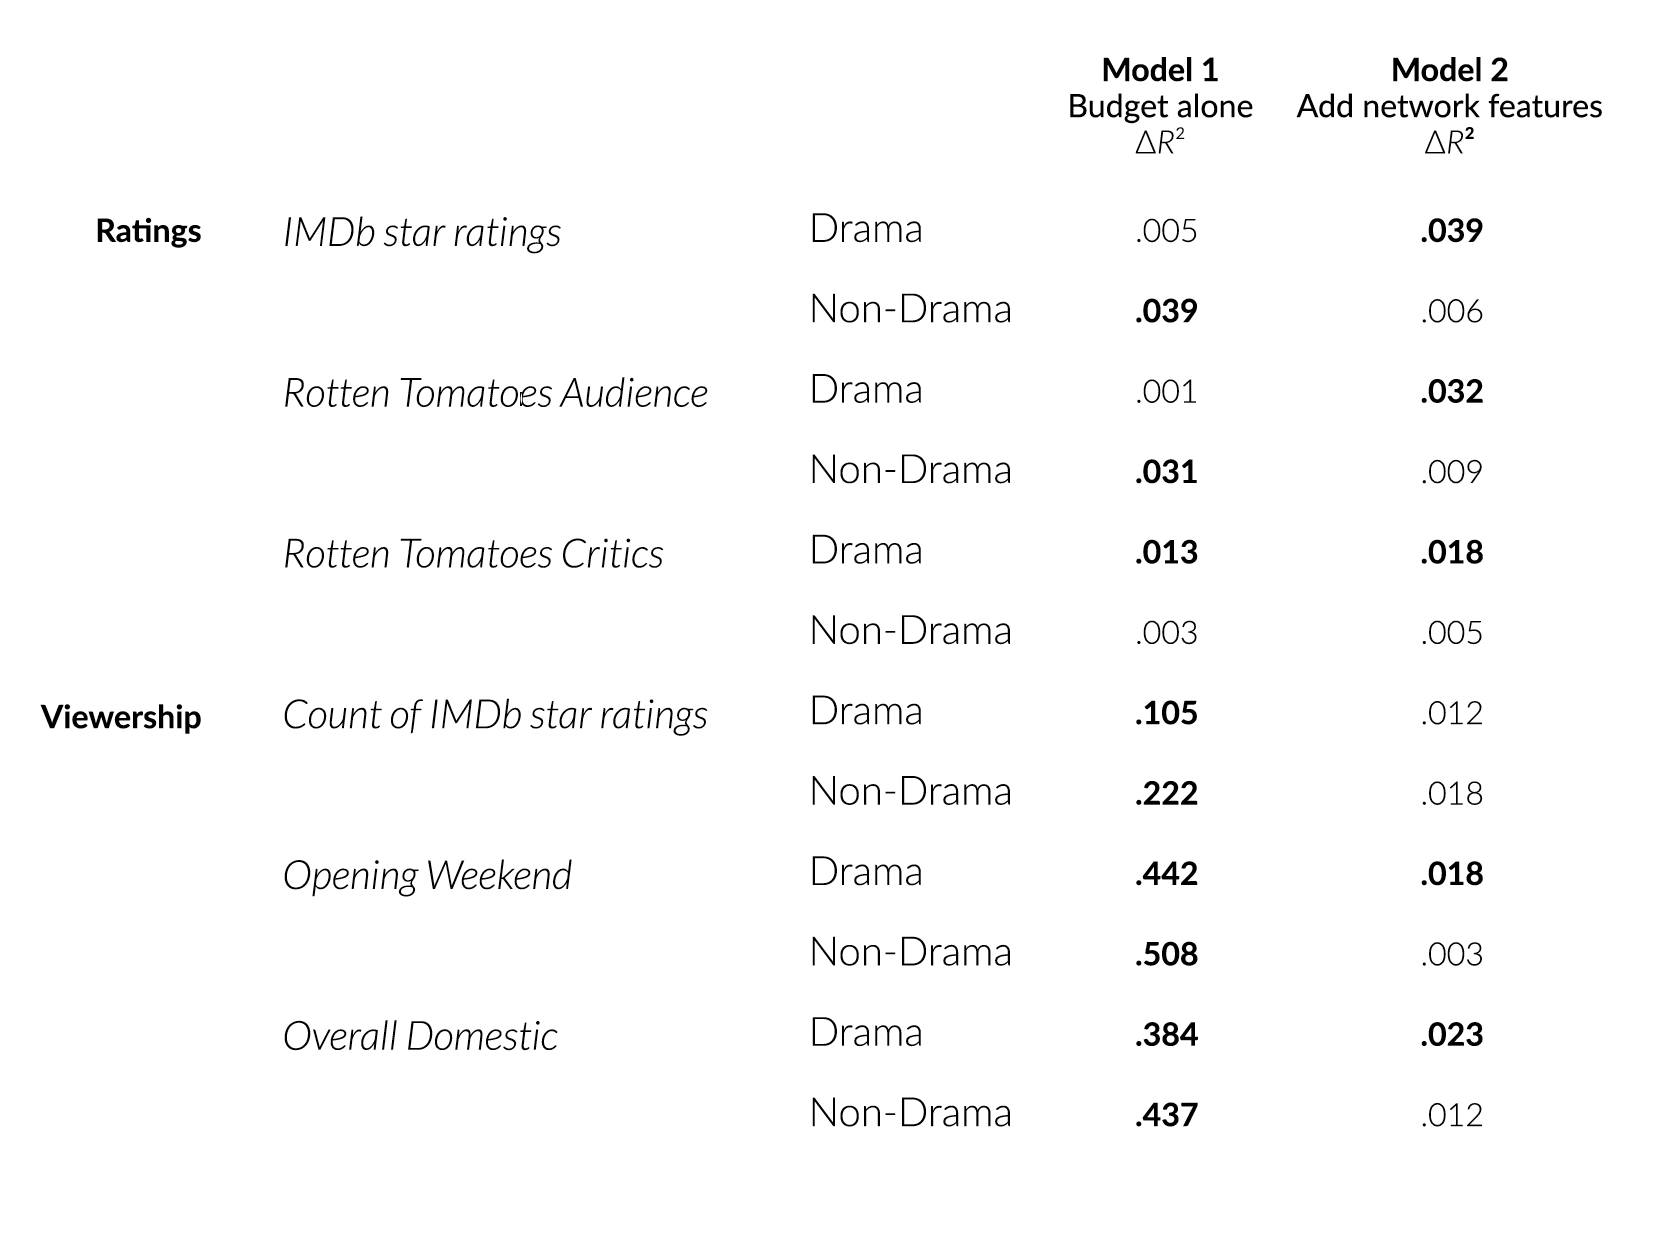
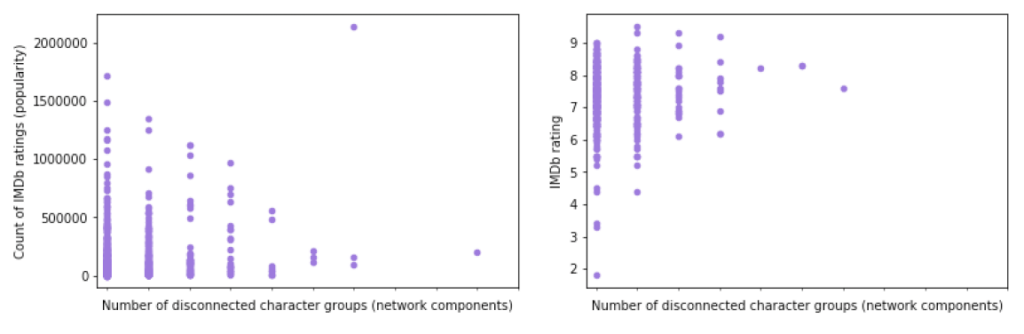
Figure 6. Relationships between number of network components (horizontal axes) and success metrics (vertical axes). It is important to note that 65% of feature films and 75% of pilot episodes had a single network component, and so the vast majority of titles in the scatterplots for viewership below are crammed into the lower left of the graph. As a result, the graphs for domestic gross, opening weekend, and counts of IMDb ratings under-emphasize the strength of the positive association. In a secondary analysis, we removed five prominent outliers in these scatterplots for films, which did not affect statistical significance.
Feature films
Pilot episodes
Sidebar: Do character network archetypes exist?
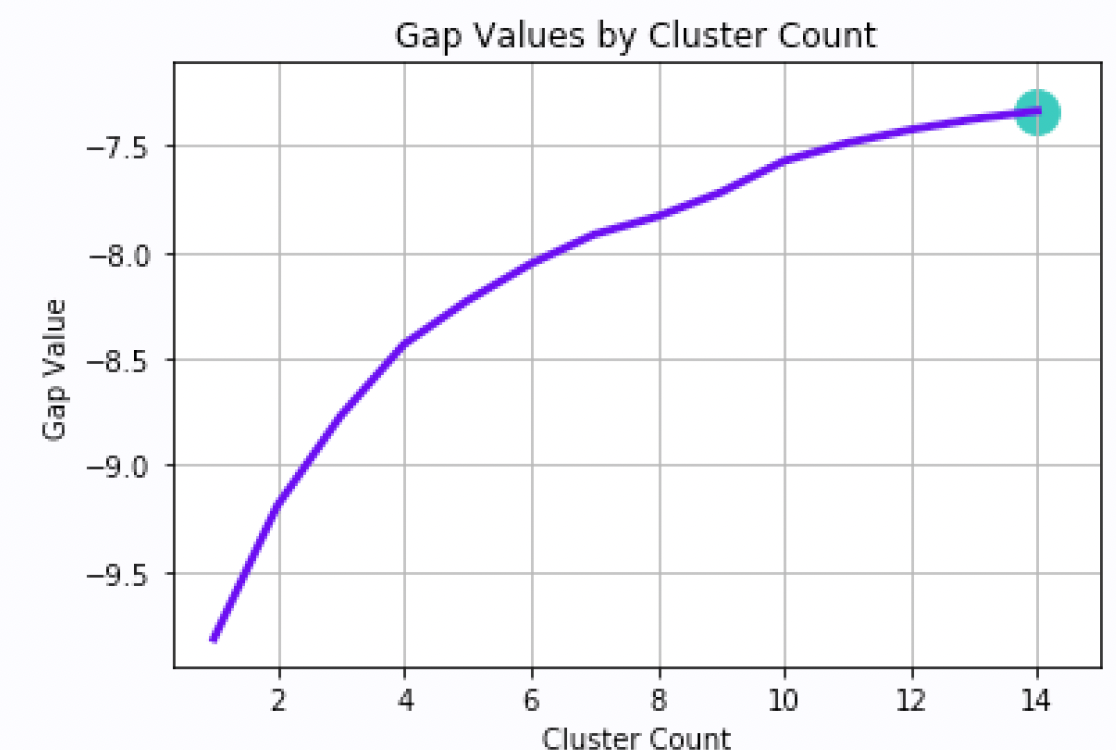
The possibility of whether character-network archetypes exist that differentiate on genre or other factors is intriguing. Our analysis reveals, although differences between drama/non-drama do exist in terms of network structure (and corroborating above patterns in the section on drama vs. non-drama network features, differences are more visible–see Figure 7–in pilot episodes than in films), those differences are quantitative rather than categorical. No clusters were detected using a technique known as K-means, along with silhouette and gap analyses, at least in terms of nodes, edges, components, and density. See Figures 7 and 8.
Figure 7. Film versus episodic networks plotted according to network features. Drama (mint/purple) versus non-drama (gray/light gray) plotted together across all four network features. We used multidimensional scaling to visualize the four network dimensions here in two dimensions. The drama to the right is The Other Side of the Wind, with 98 character nodes, 864 edges, and .18 density. The non-drama at the top-left is The Week Of, with 82 character nodes, 680 edges, and .20 density.
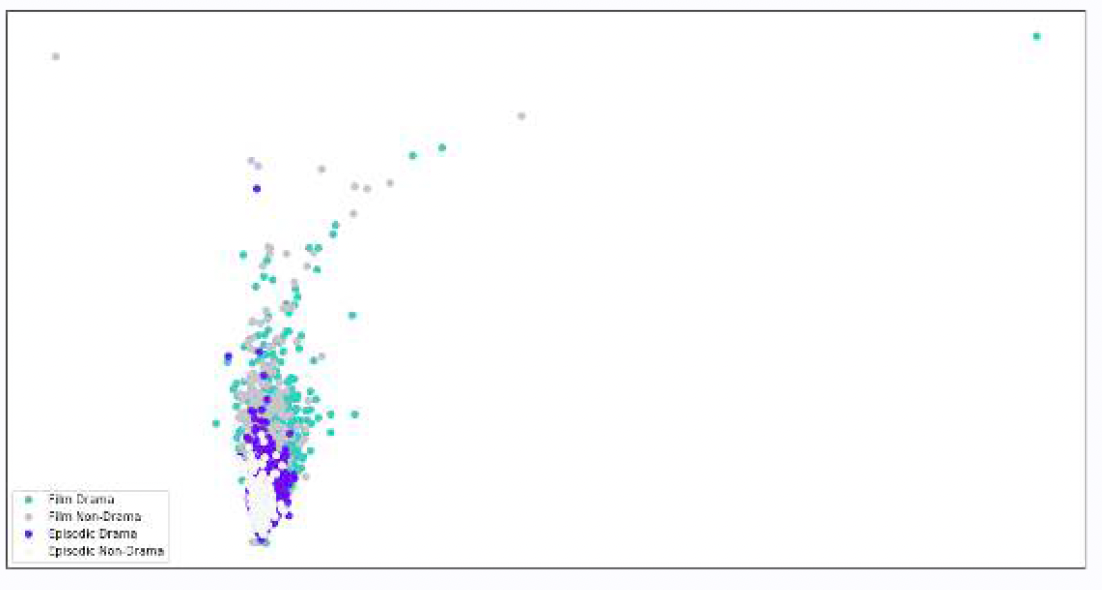
Figure 8. Gap analysis did not reveal an optimal number of clusters (no upward elbow in curve).
5. Key questions and answers
We found favorable relationships between the number of character-network components in dramas and success outcomes. Pilot episodes with more than one component showed greater viewership (for both the specific episode and the overall series) regardless of whether we control for runtime or not. And for films, we saw the number of components predict both viewership and ratings regardless of whether we controlled for the film budget or runtime. Although the majority of dramas have a single network component, both films and pilot episodes with more than one network component reliably do better. By contrast, we did not detect any effects of components on success for other genres.
What is behind this pattern? Why do more network components reliably predict success for drama specifically? To answer this question it helps to look at specific examples, consider the writing process, as well as understand audience reception.
Learn by example: storytelling functions of multiple character-network components
With regard to specific examples, the storytelling functions of multiple character-network components are varied. Multiple components sometimes represent separate but connected storylines, where the writer zooms in on specific areas of the metaphorical chess board in order to tell a larger story. Such cases can be found in Game of Thrones, The Dark Knight, and Dr. Strangelove. Other functions include one-off interactions that are there to provide information efficiently. For example, when Strollo and Mosca roam the streets in search of young Vito in The Godfather Part II creating tension and motivating his escape to the U.S.. Also, when interacting students made fun of Walter White’s car-wash job in Breaking Bad, it revealed his character motivations.
In terms of emotional functions, sometimes writers use these character-network components for emotional preparation, mental palate cleansers, or shielding from violence. For example, in V for Vendetta, rather than showing an ultra-violent scene with blood and gore (which may cause audiences to grimace, or even decrease their liking for the main character) directly, the audience is shielded from the gut-wrenching emotion by showing auxiliary characters listening to the violence indirectly from wiretaps they can hear from inside a van.
Similarly, in The Pianist, which starts with the main character neatly dressed in a wealthy home, the level of degradation, squalor, and violence slowly increase over time. One auxiliary network component consists of an old man trying to steal a desperate woman’s soup. One of the functions of the scene is to emotionally prepare the audience for worse to come, as it is one of the earliest emotional signals in the story of something terribly wrong. The scene simultaneously provides a timing buffer while the protagonist waits for a friend to be released from confinement.
Character-network components
Although these examples might be useful as formulas for creative use of network components in some cases, the reason for the association between components and success for drama is deeper. It is important to consider audience reception as well as production processes to interpret the pattern.
It seems by definition, having more network components should require greater mental effort for audiences as they must track new characters and relationships. In some cases, components add substantial variation to the narrative by expanding the story into completely different interaction dynamics and settings, such as in Game of Thrones. It may be the case that the reason network features are predictive for drama more than non-drama is that network components’ added complexity makes them more thought provoking and meaningful.
But it is also the case that multiple character-network components require greater time and effort on the part of writers due to the added complexity and need to be innovative. Writers must be conscientious to weave a more complicated tale. Writers who are willing to put in the time and effort that generate more complicated character networks will likely have their conscientiousness permeate the entire script and make it more appealing to audiences in other ways as well. If true, then other forms of complex storytelling, such as time jumps, non-linearity, or shifts in first-person perspective (such as those made famous by Rashomon), are likely to also favorably impact ratings and viewership of drama.
Of course, using such techniques is no guarantee of success. For example, the film Downsizing performed lower than average on all metrics yet had four network components extracted from the script. Critics featured on Rotten Tomatoes blasted the story for not having a point, and this seems clearly reflected in the scenes where the network components are visible. For example, one such component in Downsizing consisted of two medical workers cracking “fat jokes” about unconscious patients, and another consisted of two people crassly selling an upscale lifestyle. These scenes, although thematically related to the film’s critique of consumerism, could have been completely omitted without hampering audience understanding of the plot. These examples highlight how effective use of fragmented character groups (components) is not a simple matter of adding more of them to a story even though they do
statistically indicate quality.
Conclusion
Many treatises on drama writing, from those of Aristotle to Aaron Sorkin, contain advice that character interactions should “move the plot forward.”28
Additional network components in drama reflect creative ways of moving forward a plot emotionally or informationally.
What is it about a specific story that allows for the shifting of focus to different settings, characters, and situations? How can one make sure additional character groups introduce tension and move the plot forward in a genuine way? Storytellers must answer these questions separately for each use case.
Apart from their more direct impact on audience ratings and viewership, multiple network components might also lend more long-term viability and franchisability to the story since there are more narrative threads from which writers can pull ideas. (Indeed, Game of Thrones, with its multiple storylines, happens to be the highest rated in terms of franchisability.) Audiences love thrills, but they are also searching for more thought-provoking meaning in this dramatic content. By considering how a story might be told from the perspective of more character groups, on a grander scale, or even just more important one-off interactions between otherwise unimportant characters, it may be able to add a thought-provoking and insightful nuance that generates audience buzz and long-term viewership. And, as mentioned above, this type of complex storytelling is just one way of adding engaging complexity to a drama.
Throughout history, there have been great storytellers who understood these dynamics, at least intuitively. But the impact of these granular narrative features on aggregate patterns of audience reception has, until now, gone unmeasured. Storytellers no longer need to completely rely on their gut when making creative decisions. StoryFit technology reveals the large-scale impact of storytelling as a craft thereby helping us to find these hidden lessons buried in the data.
References
1Parrot Analytics (2019, Oct. 1) The Global Television Demand Report Q3 2019 Insights.parrotanalytics.com. Retrieved April 28 2020, from https://insights.parrotanalytics.com/svod-tv-market-share-q3-2019
2Brantner, C. (2019, March 20). More Americans Now Pay For Streaming Services Than Cable TV. Forbes.com. Retrieved April 28 2020, from https://www.forbes.com/sites/chrisbrantner/2019/03/20/americans-now-pay-more-for-streaming-services-than-cable-tv/#5ca04f9afcdd
3Westcott, Loucks, Ciampa, Srivastava, (2019, Oct. 30). Digital media trends: A look beyond generations:
Redrawing battle lines in the video streaming war. www2.deloitte.com. Retrieved April 28 2020, from
https://www2.deloitte.com/us/en/insights/industry/technology/digital-media-trends-consumption-habits-survey/video-streaming-wars-redrawing-battle-lines.html
4Sutton, K. (2020, March 16). Self-Isolating Because of Coronavirus? You’re Probably Watching TV Americans’ television viewing jumped nearly 60% during past crises, Nielsen said. Adweek.com Retrieved April 28 2020, from https://www.adweek.com/tv-video/self-isolating-because-of-coronavirus-youre-probably-watching-tv/
5Covid-19 is a short-term boon to streaming services. (2020, March 27). Economist.com Retrieved April 28 2020, from https://www.economist.com/graphic-detail/2020/03/27/covid-19-is-a-short-term-boon-to-streaming-services
6Barnes, B. (2019, Nov. 19). The Streaming Era Has Finally Arrived. Everything Is About to Change. Once a generation, Hollywood experiences a seismic shift. It is happening again. Nytimes.com Retrieved April 28 2020, from https://www.nytimes.com/2019/11/18/business/media/streaming-hollywood-revolution.html?action=click&module=Editors%20Picks&pgtype=Homepage
7Clark, T. (2020, Feb. 12). Netflix has lost 3,000 movies in the last decade, but its originals catalog has soared to 1,100. Businessinsider.com Retrieved April 28 2020, from https://www.businessinsider.com/how-netflix-movie-and-tv-show-catalog-changed-over-time-2020-2
8Koblin, J. (2020, Jan. 9). Peak TV Hits a New Peak, With 532 Scripted Shows The number of original series continued to swell in 2019, with Apple and Disney adding to the glut. When will the bubble pop? Nytimes.com Retrieved April 28 2020, from https://www.nytimes.com/2020/01/09/business/media/tv-shows-2020.html
9Watson, A. (2019, Aug. 19). Most popular TV genres in the U.S. 2017. Statista.com Retrieved April 28 2020, from https://www.statista.com/statistics/201565/most-popular-genres-in-us-primetime-tv/
10Statista Research Department (2016, March 23). Share of consumers who binge view TV shows in the United States as of November 2015, by age and genre. Statista.com Retrieved April 28 2020, from
https://www.statista.com/statistics/431170/most-binged-tv-show-genre-by-age-us/
11Clark, T., & Gal, S. (2018, Sept. 25) In the TV war between Netflix and Amazon, each is leaning into different genres. Businessinsider.com Retrieved April 28 2020, from https://www.businessinsider.com/chart-shows-netflix-and-amazon-genre-breakdown-for-tv-and-movies-2018-9
12Watson, A. (2020, Jan. 9). Movie releases in North America from 2000-2019. Statista.com Retrieved April 28 2020, from https://www.statista.com/statistics/187122/movie-releases-in-north-america-since-2001/
13Lowry, B. (2019, Aug. 26). ‘The Mandalorian’ and Marvel blur line between movies and streaming. Cnn.com Retrieved April 28 2020, from https://www.cnn.com/2019/08/26/entertainment/streaming-wars-column/index.html
14Rossolillo, N. (2019, Jul. 19). Netflix Investors: Get Ready for Subscriber Churn. Fool.com Retrieved April 28 2020, from https://www.fool.com/investing/2019/07/19/netflix-investors-get-ready-for-subscriber-churn.aspx
15Dixon, M. (2019, April 5). How Netflix used big data and analytics to generate billions. Seleritysas.com Retrieved April 28 2020, from https://seleritysas.com/blog/2019/04/05/how-netflix-used-big-data-and-analytics-to-generate-billions/
16IMDb genre definitions. Imdb.com Retrieved April 28, 2020, from https://help.imdb.com/article/contribution/titles/genres/GZDRMS6R742JRGAG#
17Lewis, R. J., Grizzard, M., Lea, S., Ilijev, D., Choi, J. A., Müsse, L., & O’Connor, G. (2017). Large-Scale Patterns of Entertainment Gratifications in Linguistic Content of US Films. Communication Studies, 68(4), 422-438.
18Lewis, R. J., & Mitchell, N. (2014). Egoism versus altruism in television content for young audiences. Mass Communication and Society, 17(4), 597-613.
19Eden, A., Daalmans, S., & Johnson, B. K. (2017). Morality predicts enjoyment but not appreciation of
morally ambiguous characters. Media Psychology, 20(3), 349-373.
20Zillmann, D., & Bryant, J. (1994). Entertainment as a media effect. In J. Bryant & D. Zillmann (Eds.), Media effects: Advances in theory and research (pp. 437–461). Hillsdale, NJ: Lawrence Erlbaum Associates.
21Oliver, M. B., & Bartsch, A. (2010). Appreciation as audience response: Exploring entertainment
gratifications beyond hedonism. Human Communication Research, 36(1), 53-81.
22Martins, N., Mares, M. L., Malacane, M., & Peebles, A. (2016). Liked Characters Get a Moral Pass: Young Viewers’ Evaluations of Social and Physical Aggression in Tween Sitcoms. Communication Research, 1, 1-25.
23Lewis, R. J., Grizzard, M., Mangus, J. M., Rashidian, P., & Weber, R. (2017). Moral clarity in narratives elicits greater cooperation than moral ambiguity. Media Psychology, 20(4), 533-556.
24Lewis, R. J., Tamborini, R., & Weber, R. (2014). Testing a dual-process model of media enjoyment and
appreciation. Journal of Communication, 64(3), 397-416.
25Aric A. Hagberg, Daniel A. Schult and Pieter J. Swart, “Exploring network structure, dynamics, and function using NetworkX”, in Proceedings of the 7th Python in Science Conference (SciPy2008), Gäel Varoquaux, Travis Vaught, and Jarrod Millman (Eds), (Pasadena, CA USA), pp. 11–15, Aug 2008
26Oliver, M. B., Ash, E., Woolley, J. K., Shade, D. D., & Kim, K. (2014). Entertainment we watch and
entertainment we appreciate: Patterns of motion picture consumption and acclaim over three decades. Mass Communication and Society, 17(6), 853-873.
27IMDb Datasets. Imdb.com Retrieved April 28, 2020, from https://www.imdb.com/interfaces/
28Sorkin, A. Aaron Sorkin teaches screenwriting. Masterclass.com. Retrieved April 30, 2020, from
https://www.masterclass.com/classes/aaron-sorkin-teaches-screenwriting
29Parrot Analytics (2019, Oct. 1) Parrot Analytics’ new TV data metrics reveal that Game of Thrones has the highest franchisability Parrotanalytics.com Retrieved April 30 2020, from https://www.parrotanalytics.com/announcements/parrot-analytics-new-tv-data-metrics-reveal-that-game-ofthrones-has-the-highest-franchisability/